
Int J Pharm Pharm Sci, Vol 17, Issue 4, 31-42Original Article Article
DEVELOPMENT AND VALIDATION OF RELATED SUBSTANCE BY HPLC FOR DIPHENHYDRAMINE HYDROCHLORIDE SOFT GEL CAPSULE
CHINNMAYKUMAR OZA*
Apnar Pharma LLP, 10 Lake Dr, East Windsor, New Jersey, USA 08520
*Corresponding author: Chinnmaykumar Oza; *Email: chinmayoza12@gmail.com
Received: 16 Jan 2025, Revised and Accepted: 22 Feb 2025
ABSTRACT
Objective: Many over-the-counter drug products does not have official compendial analytical methods for the analysis of the drug product. Thus, the United States Pharmacopeia (USP) are seeking to develop and validate new methods to establish analysis standards for the assessment of pharmaceutical over-the-counter drug products. One such method is the related substances by high-performance liquid chromatographic (HPLC) of diphenhydramine hydrochloride capsule.
Methods: A reversed-phase high-performance liquid chromatographic method for related substances of diphenhydramine hydrochloride capsule was developed comprising of YMC pack pro C8 column 250×4.6 mm, S-5µm, 12 nm HPLC column using waters Alliance 2690 HPLC system with a mobile phase of 65% of pH 3 monobasic potassium phosphate buffer and 35% of acetonitrile. The flow rate was 1.2 ml/min, 10 µl injection volume, at 220 nm wavelength with the column temperature of 25 °C. The method was validated as per International Council for Harmonisation of Technical Requirements for Pharmaceuticals (ICH) Q2R2 guidelines for specificity, precision (system precision, method precision), linearity, accuracy, solution stability and robustness (filter study).
Results: The method found to be specific without any interference from placebo and spiked sample with the retention time of 5.2 min, 5.5 min, 7.0 min, 23.2 min and 46.1 min for Diphenhydramine Related Compound-A (DRC-A), diphenhydramine hydrochloride, Diphenhydramine N-Oxide (DNO), benzhydrol and benzophenone respectively. The % Relative Standard Deviation (RSD) for DRC-A, DNO, benzhydrol and benzophenone was observed to be as 6.2, 5.9, 6.3 and 5.5, respectively. The accuracy ensures the detection and quantification at a very low level for all impurities [Limit Of Quantification (LOQ) 0.03%] with coefficient correlation of 0.9999, 0.9977, 0.9992, 0.9995,0.9990 and % RSD for LOQ precision was determined as 0.9, 2.1, 0.8, 1.9 and 8.0 for DRC-A, diphenhydramine hydrochloride, DNO, benzhydrol and benzophenone respectively. Since, DNO impurity is degradation impurity and vital in drug products and required to address its consistency and assurance towards the safety of patient, this method ensures to quantitate it at low level with precision and accuracy. Thus, the consistent, linear, precise, accurate and stability indicating results makes it more suitable for quantification of related substances in finished product and stability analysis.
Conclusion: The study findings shows that the method is quite simple and applicable for release of finished product for the related substance analysis of diphenhydramine hydrochloride soft gel capsule.
Keywords: Diphenhydramine hydrochloride, HPLC, ICH, Validation, Quality guidelines, Capsule, Soft gel
© 2025 The Authors. Published by Innovare Academic Sciences Pvt Ltd. This is an open access article under the CC BY license (https://creativecommons.org/licenses/by/4.0/)
DOI: https://dx.doi.org/10.22159/ijpps.2025v17i4.52727 Journal homepage: https://innovareacademics.in/journals/index.php/ijpps
INTRODUCTION
Diphenhydramine is a first-generation H1 receptor antagonist (H1 blocker) antihistamine over-the-counterdrug, which is used to treat allergy, hay fever and the common cold symptoms [1]. It is also used to relieve cough caused by minor throat or airway irritation, foreign particles and microbes [2]. diphenhydramine hydrochloride is also used to treat motion sickness and to induce sleep [2]. diphenhydramine hydrochloride is also known as Ethanamine, 2-(diphenylmethoxy)-N,N-dimethyl-,hydrochlorideand 2-(Diphenylmethoxy)-N,N-dimethyl-ethylamine hydrochloride. Diphenhydramine hydrochloride has a molecular weight of 291.82 and molecular formula of C17H21NO. HCl [3]. Diphenhydramine hydrochloride is manufactured in different forms such as tablet, capsule, oral solution. Furthermore, it can be formulated with other over-the-counter drugs like, phenylephrine hydrochloride [4], dextromethorphan [4], chlorpheniramine, cyproheptadine, naproxen sodium [5] etc. and makes it available for allergy and cold relief drug due its antihistamine properties.
Fig. 1: Structure of diphenhydramine hydrochloride
The United States Pharmacopeia (USP) has identified several molecule and drug products to establish a modern analysis standard for pharmaceutical over-the-counter drug products [6]. Thus, one such drug product includes the diphenhydramine hydrochloride capsule for its related substance method. The USP monograph lacks the methodology for the determination of related substances for diphenhydramine hydrochloride soft gel capsule. Thus, various methods, columns and composition of mobile phase has been executed to produce the precise and consistent results [6]. However, the nature of the molecule in the soft gel capsule did not provide stability and consistency over a period of experiments. Moreover, it contains the DNO degradation impurity and consequently, it is more crucial to develop a linear, accurate and precise method for the quantification of all impurities. Hence, related substances by HPLC method of diphenhydramine hydrochloride capsule was developed [7, 8] and validated according to ICH Q2R2 guidelines for specificity, precision, accuracy, linearity and robustness (filter study) [9].
MATERIALS AND METHODS
Various development analysis has been researched [10, 11] and performed to develop reliable, consistent and accurate methods [12, 13]. However, none of these methods have consistently produced precise and accurate results in terms of quantifying the impurities without any interference of peaks from impurities and/or excipients. Hence, A reversed-phase high-performance liquid chromatographic method with Empower data acquisition software was developed using YMC pack pro C8 column over other equivalent columns due to its sharpness and tailing of the main analyte [14]. Furthermore, mobile phase composition (35%:65%) of buffer and acetonitrile was adopted from USP drug substance [15] procedure with isocratic instead of gradient profile, which was suitable for stability of solutions.
Instrument details
HPLC – Waters Alliance 2690/2695, Analytical balance-Mettler Toledo (AT 261, PB3002) and Sartorius (CP324S). Micro Balance-Mettler Toledo (MX5), pH meter-Orion Versa star, Centrifuge-Fisher Scientific, Sonicator-Fisher Scienticific-FS28 and Bransonic ultrasonicator.
Reagents/Chemicals details
Potassium phosphate monobasic ACS grade Batch # 0756C197, Phosphoric acid (85%) HPLC grade Batch # 57060739, Acetonitrile HPLC grade Batch # 0000211898 and Purified water.
Standard and sample details
Diphenhydramine hydrochloride Working Standard (WS) [Batch # WS19/001, 99.6%], DRC-A Reference Standard (RS) [Batch # RS19/021, 98.0%], DNO RS [Batch # RS18/050, 98.9%], Benzhydrol RS [Batch # RS18/051, 99.99%], Benzophenone RS [Batch # RS18/049, 99.9%], Diphenhydramine hydrochloride liquid filled capsules 50 mg [Batch # RD18009] and diphenhydramine hydrochloride liquid filled capsules 50 mg Placebo fill-shell [Batch # RD19006P].
Analytical method
Preparation of 3.00 pH phosphate buffer
Accurately weigh and transfer 5.4 g of monobasic potassium phosphate into a beaker containing 1000 ml of purified water, stir for about 20 min or until it dissolved completely, adjust the pH to 3.00±0.05 with orthophosphoric acid. Filter the solution through 0.45µ membrane filter and degas for about 5 min.
Preparation of mobile phase: (35: 65 v/v ACN: Buffer)
Transfer 350 ml of acetonitrile and 650 ml of buffer into a bottle, mix well and degas.
Preparation of diluent/Blank
Mobile phase is used as diluent/blank.
Chromatographic conditions
Column Description-YMC pack pro C8 column 250×4.6 mm, S-5µmor Equivalent, Flow rate-1.2 ml/min, Injection volume – 10 µl, Column temperature – 25 °C, Wavelength-220 nm, Elution – Isocratic, Run time-60 min for Blank and Sample, 20 min for Standard and System suitability.
Preparation of system suitability (SST) solution: (100µg/ml of DRC-A and diphenhydramine in diluent)
Accurately weigh and transfer 0.001 g each of DRC-A and diphenhydramine hydrochloride WS into a 10 ml volumetric flask, add about 7 ml of diluent, sonicate to dissolve and make up to the volume with diluent and mix well.
Preparation of standard solution: (10µg/ml of DRC-A and 20µg/ml diphenhydramine hydrochloride in diluent)
Accurately weigh and transfer 0.02 g each of diphenhydramine hydrochloride WS into a 100 ml volumetric flask, add about 70 ml of diluent, sonicate for about 10 min to dissolve and make up to the volume with diluent and mix well.
Weigh 0.001 g of DRC-A and pipette 10 ml of the above solution and dilute to 100 ml with diluent and mixed well.
Preparation of sample solution: (Equivalent to 2000µg/ml diphenhydramine hydrochloride in diluent)
Randomly collect 20 capsules, cut open and squeeze the fill material into clean and dry flask; weigh the sample fill material equivalent to 0.1 g of diphenhydramine hydrochloride into 50 ml volumetric flask, add about 35 ml of diluent and sonicate for about 5 min and make up the mark with diluent and mix well.
Preparation of placebo sample solution: (Equivalent to 2000µg/ml diphenhydramine hydrochloride in diluent)
Randomly collect 20 placebo capsules, cut open and squeeze the fill material into clean and dry flask; weigh the placebo fill material equivalent to 0.1 g of diphenhydramine hydrochloride into 50 ml volumetric flask, add about 35 ml of diluent and sonicate for about 5 min and make up the mark with diluent and mix well.
Procedure
Inject 10 µl of Blank (one injection), SST solution (one injection), Standard solution (6 replicates), into HPLC system. Ensure that system suitability parameter meets the acceptance criteria.
Note: The relative retention time for DRC-A and diphenhydramine hydrochloride are about 0.9 and 1.0, respectively.
Acceptance criteria for system suitability
The % RSD of diphenhydramine hydrochloride and DRC-A for six replicate injections of standard should not be more than (NMT) 5.0.
The USP Tailing factor for diphenhydramine hydrochloride peak from first injection of standard solution– NMT 2.0.
The USP Plate count for diphenhydramine hydrochloride peak from first injection of standard solution should not be less than (NLT) 2500.
USP resolution between diphenhydramine hydrochloride and DRC-A in System suitability solution should be NLT 2.0.
Table 1: Relative retention time (RRT) and relative recovery factor (RRF) table of diphenhydramine and its impurities
| S. No. | Impurity name | RRT | RRF | LOQ |
| 1. | Diphenhydramine hydrochloride | N/A | N/A | 0.03% |
| 2. | DRC-A | 0.9 | 1.0 | 0.03% |
| 3. | DNO | 1.2 | 1.0 | 0.03% |
| 4. | Benzhydrol | 4.7 | 1.5 | 0.03% |
| 5. | Benzophenone | 9.3 | 0.8 | 0.03% |
Impurities IUPAC names
Diphenhydramine N – Oxide: 2-(benzhydryloxy)-N,N-dimethylethan-1-amine oxide; Benzhydrol: Diphenylmethanol; Benzophenone: Diphenylmethanone.
Calculations
Determine the amount of % of DRC-A Impurity according to the following formula,

Where,
AT = Peak Area of DRC-A impurity in sample solution
AR = Average area of DRC-A in standard solution
Ws = Weight of DRC-A RS used in standard preparation, in g
Wt = Weight of liquid fill used for sample preparation, in g
Avg Wt = Average weight of fill in each capsule, in g
P = Potency of Working/Reference standard, in percentage
LC = Label claim of diphenhydramine per capsule (0.05g)
RRF = Relative response factor
Determine the amount of % of other known, according to the following formula,

Where,
AT = Peak Area of diphenhydramine impurity in sample solution
AR = Average area of diphenhydramine in standard solution
Ws = Weight of diphenhydramine WS used in standard preparation, in g
Wt = Weight of liquid fill used for sample preparation, in g
Avg Wt = Average weight of fill in each capsule, in g
P = Potency of Working/Reference standard, in percentage
LC = Label claim of diphenhydramine per capsule (0.05g)
RRF = Relative response factor
Determine the amount of % of Unknown Impurity according to the following formula,

Where,
AT = Peak Area of diphenhydramine impurity in sample solution
AR = Average area of diphenhydramine in standard solution
Ws = Weight of diphenhydramine WS used in standard preparation, in g
Wt = Weight of liquid fill used for sample preparation, in g
Avg Wt = Average weight of fill in each capsule, in g
P = Potency of Working/Reference standard, in percentage
LC = Label claim of diphenhydramine per capsule (0.05g)
RRF = Relative response factor
Acceptance criteria
DRC-A: NMT 0.5%, DNO: NMT 3.0%, Benzhydrol: NMT 2.0%, Benzophenone: NMT 0.4%, Individual unknown impurity: NMT 0.2%
Validation parameters
The analytical method was validated as per ICH Q2R2 guidelines for system suitability, specificity, precision, linearity, LOQ and Limit of Detection (LOD), accuracy and robustness (filter study) study parameter [9].
System suitability
The system suitability and standard solution was prepared by using diphenhydramine hydrochloride WS (Batch # WS19/001) and DRC-A RS (Batch # RS19/021) as per test method and injected system suitability (one injection) and standard solution (in six replicates) into the HPLC system. The system suitability parameters were evaluated and found to be within the limits.
Specificity
Placebo interference
A study was conducted on the diphenhydramine hydrochloride liquid filled capsules 0.05 g, placebo (Batch # RD19006P) to verify the interference of placebo; prepared placebo preparations in duplicate as per the test method and injected into HPLC system. The chromatogram of placebo showed no peaks at the retention time of analyte peak and its related impurities.
Impurity interference
Prepared the impurities (DRC-A, DNO, benzhydrol, benzophenone) solutions individually at impurity specification level of test concentration and injected into the HPLC system as per the test method. The chromatogram of impurity peak was not eluted at the retention time of analyte (main) peak.
Precision
Precision for known impurity
The precision of test method was evaluated by preparing six test solutions of diphenhydramine hydrochloride liquid-filled capsules 0.05 g (Batch # RD18009) as per test method, followed by spiking DRC-A, DNO, benzhydrol and benzophenone impurity stock solution at specification level. The % RSD of impurities was found to be within the limit, indicating that the method is precise.
LOQ precision
Six test solutions were prepared by spiking diphenhydramine hydrochloride, DNO, benzhydrol and benzophenone impurities on the placebo preparation (Batch # RD19006P) at the LOQ level and injected into HPLC as per test method. The % RSD of obtained from % content of diphenhydramine and related impurities from six preparations were found to be within limits, indicating that the method is precise at LOQ level.
Six test solutions were prepared by spiking DRC-A Impurity at the LOQ level on the placebo preparation (Batch # RD19006P) with diphenhydramine hydrochloride at test concentration level and injected into the HPLC as per the test method. The % RSD of obtained from % content of DRC-A from six preparations were found to be within limits, indicating that the method is precise at LOQ level.
Linearity
The Linearity of detector response for diphenhydramine hydrochloride and known impurities test method was evaluated by preparing test solutions ranging from LOQ to 150% of the specification limit. The correlation coefficient of known impurities and unknown impurity was found to be within the acceptance criteria indicating that the method is Linear.
LOD and LOQ
LOD and LOQ for diphenhydramine hydrochloride known impurities and diphenhydramine hydrochloride were established using the signal-to-noise (S/N) ratio method. The S/N values found at the LOQ and LOD levels were within the acceptance criteria limits.
Accuracy
Accuracy for known impurity
The study of accuracy was conducted at 100 % of specification limit of known impurity. Six samples were prepared and analysed as per test method. The % individual and mean recovery of impurities were found to be within the limits, indicating that the method is accurate.
Accuracy for unknown impurity
The study of accuracy was conducted at 100 % of specification limit of unknown impurity. Six placebo solutions equivalent to test concentration were prepared and analysed as per test method. The % individual and mean recovery of diphenhydramine was found to be within the limits, indicating that the method is accurate.
Solution stability
The study to establish the stability of standard preparation and spiked test preparation (Batch # RD18009) on Bench Top (BT) and in refrigerator was conducted at Initial, after 1 day, after 2 days and after 7 days. The similarity factor for standard preparation was estimated against a freshly prepared standard at each time. For the Spiked test preparation % impurities in test preparation were estimated each time [16]. From the above study, it was established that the standard and test preparation were stable up to 7 days on BT and in the refrigerator.
Robustness (Filter study)
A study was conducted to determine the filter compatibility to the samples. Prepared the sample solution (in duplicate) as per test method for the Batch # RD18009 and some portion of test solution filtered through 0.45µm Nylon filter and 0.45µm Polyvinylidene Fluoride (PVDF) syringe filter separately and injected into the HPLC system [16]. The variation of impurities between unfiltered and filtered sample respectively found to be within the limit.
RESULTS AND DISCUSSION
System suitability
Acceptance criteria
The % RSD of diphenhydramine hydrochloride and DRC-A for six replicate injections of standard should not be more than 5.0.
The USP tailing factor for diphenhydramine hydrochloride peak from first injection of standard solution should not be more than 2.0.
The USP Plate count for diphenhydramine hydrochloride peak from first injection of standard solution should not be less than 2500.
USP resolution between diphenhydramine hydrochloride and DRC-A in system suitability solution should be NLT 2.0.
The system suitability criteria were well within the acceptance criteria with 0.3% of RSD for diphenhydramine hydrochloride and DRC-A peaks. The tailing factor and plate count was obtained as 1.4 and 18636, respectively and found better than those similar research study of Al Bratty et al. on Assay analysis of diphenhydramine hydrochloride and naproxen sodium tablets [5]. Furthermore, the resolution was established as 2.9 and ensures the precise suitability results.
Table 2: Results of system suitability
| System suitability parameter | Results |
| The % RSD of diphenhydramine hydrochloride peak areas in standard solution | 0.3 |
| The % RSD of DRC-A peak areas in standard solution | 0.3 |
| USP tailing factor for diphenhydramine hydrochloride peak for first injection of standard | 1.4 |
| USP plate count for diphenhydramine hydrochloride peak for first injection of standard | 18636 |
| USP resolution between diphenhydramine hydrochloride and DRC-A in standard solution | 2.9 |
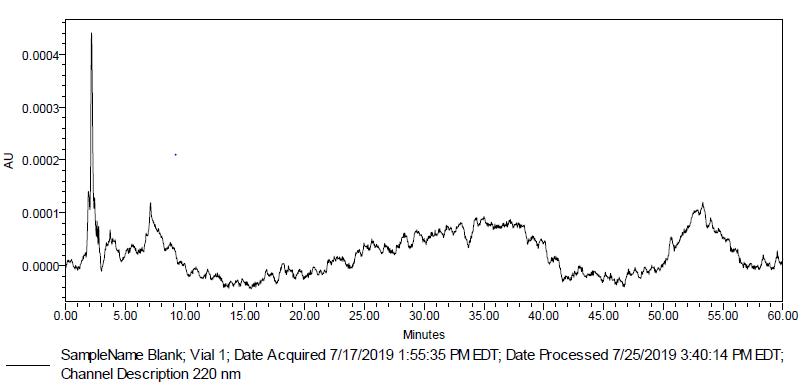
Fig. 2: Typical chromatogram of blank
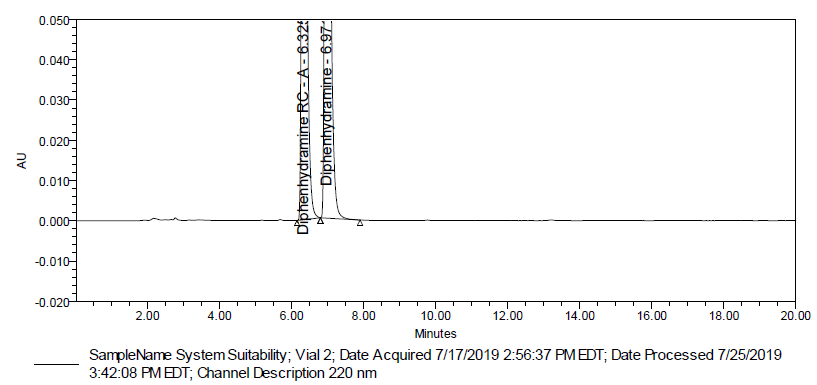
Fig. 3: Typical chromatogram of system suitability
Table 3: Results of impurity interference
| Batch # | Name | Individual retention time (min) | Retention time (min) | Purity angle | Purity thresh hold | Purity flag |
| RD18009 | DRC-A | 5.25 | 5.19 | 0.136 | No |
|
| Diphenhydramine hydrochloride | - | 5.48 | No |
|||
| DNO | 7.05 | 7.03 | No |
|||
| Benzhydrol | 23.16 | 23.30 | No |
|||
| Benzophenone | 46.12 | 46.32 | No |
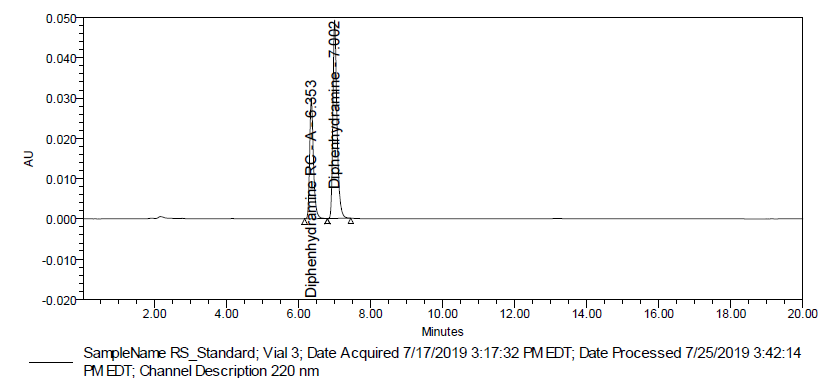
Fig. 4: Typical chromatogram of standard
Specificity
Acceptance criteria
The chromatograms of placebo should not show any peak at the retention time of analyte peak. The chromatograms of impurity peaks should not elute at the retention time of analyte peak or peak purity of main peak in spiked sample should pass.
There is no interference found at the retention time of diphenhydramine hydrochloride from placebo and spiked sample with impurities and diphenhydramine (main peak) observed to be pure in the spiked sample. Moreover, the purity angle shows that the peaks are pure and doesn’t interfere with any other peaks. Hence, the method is determined as specific.
Precision
Acceptance criteria
The % RSD of individual known impurity should be no more than 15.0%.
% RSD for DRC-A, DNO, benzhydrol and benzophenone was determined as 6.2%, 5.9%, 6.3% and 5.5%, respectively at 100% level, whereas research study from Kirkpatrick D et al. shows the similar results with spiking the impurities at 50% level [6]. Thus, The % RSD of individual known impurity results for sample obtained well within acceptance criteria and determined as precise method.
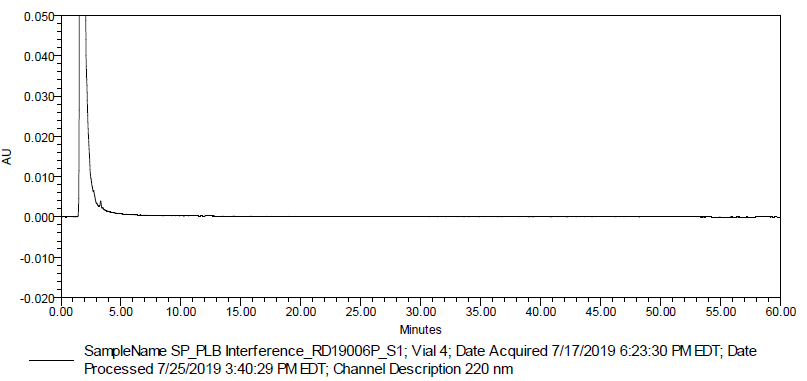
Fig. 5: Typical chromatogram of placebo interference (Batch # RD19006P)
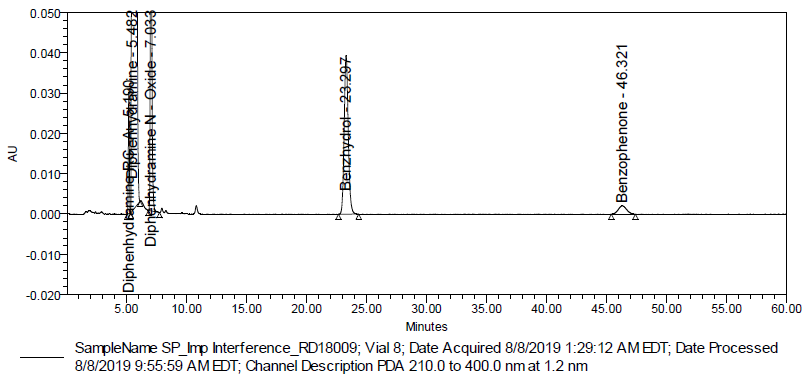
Fig. 6: Typical chromatogram of spiked sample (Batch # RD18009)
Table 4: Results of precision for known impurities
| Batch # | Precision sample # | % DRC-A | % DNO | % of benzhydrol | % of benzophenone |
| RD18009 | 1 | 0.517 | |||
| 2 | 0.509 | 2.556 | 2.056 | 0.437 | |
| 3 | 0.462 | 2.350 | 1.862 | 0.406 | |
| 4 | 0.512 | 2.593 | 2.064 | 0.438 | |
| 5 | 0.451 | 2.291 | 1.826 | 0.389 | |
| 6 | 0.461 | 2.334 | 1.879 | 0.401 | |
| Mean* | 0.485±0.030 | 2.456±0.146 | 1.966±0.124 | 0.419±0.023 | |
| % RSD | 6.2 | 5.9 | 6.3 | 5.5 |
*Data is given as mean±SD (n = 6), SD (Standard Deviation)
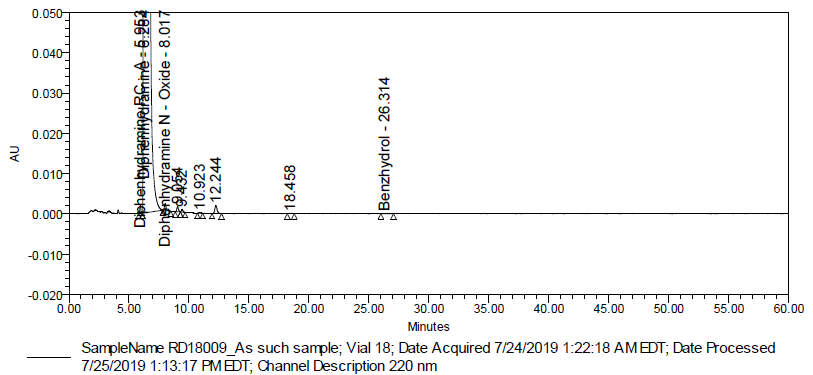
Fig. 7: Typical chromatogram of control sample (Batch # RD18009)
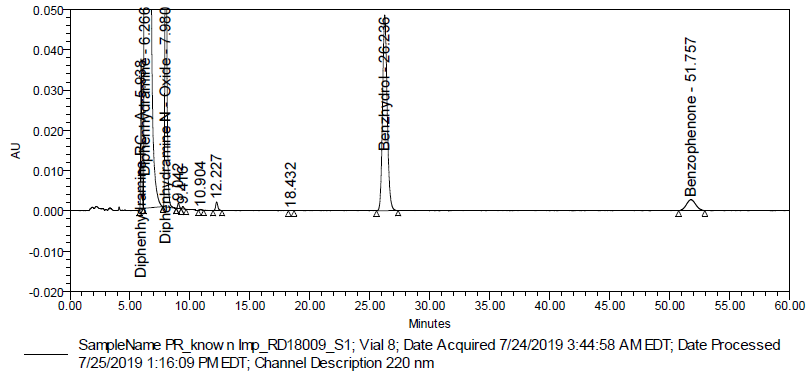
Fig. 8: Typical chromatogram of a precision sample (Batch # RD18009)
Table 5: Results of LOQ Precision for known and unknown impurity (Batch # RD19006P)
| Batch # | Sample # | % Content of | ||||
| Diphenhydramine hydrochloride | DNO | Benzhydrol | Benzophenone | DRC-A | ||
| RD19006P | 1 | 0.611 | 0.839 | |||
| 2 | 0.628 | 0.541 | 0.582 | 0.663 | 0.853 | |
| 3 | 0.627 | 0.543 | 0.610 | 0.702 | 0.834 | |
| 4 | 0.606 | 0.548 | 0.600 | 0.621 | 0.841 | |
| 5 | 0.600 | 0.541 | 0.588 | 0.707 | 0.844 | |
| 6 | 0.600 | 0.549 | 0.607 | 0.575 | 0.831 | |
| Mean* | 0.612±0.013 | 0.543±0.004 | 0.599±0.011 | 0.648±0.052 | 0.840±0.008 | |
| % RSD | 2.1 | 0.8 | 1.9 | 8.0 | 0.9 | |
*Data is given as mean±SD (n = 6), SD (Standard Deviation)
LOQ precision
Acceptance criteria
The % RSD of % content of known impurities and diphenhydramine hydrochloride from 6 sample preparations at LOQ level should be no more than 20.0%
The % RSD for individual known impurities and diphenhydramine hydrochloride at LOQ level was established as 2.1%, 0.8%, 1.9%, 8.0% and 0.9% for diphenhydramine hydrochloride, DNO, benzhydrol, benzophenone and DRC-A respectively whereas research study from Kirkpatrick D et al. does not obtain LOQ precision results [6]. Thus, the method produces precise results at LOQ level (i. e. 0.03% for all impurities) and ensures the precise quantification of low-level impurities.
Table 6: Results for linearity of DRC-A
| Sample # | Linearity level | Concentration (µg/ml) | Area |
| 1 | LOQ | 0.59 | 23756 |
| 2 | 10 % | 0.98 | 32258 |
| 3 | 50 % | 4.90 | 119467 |
| 4 | 100% | 9.81 | 227895 |
| 5 | 125% | 12.26 | 279748 |
| 6 | 150% | 14.71 | 332301 |
| Co-efficient of correlation | 0.999934 | ||
| Intercept | 11376.528 | ||
| Slope | 21899.788 | ||
| Bias @100% | 5.0 |
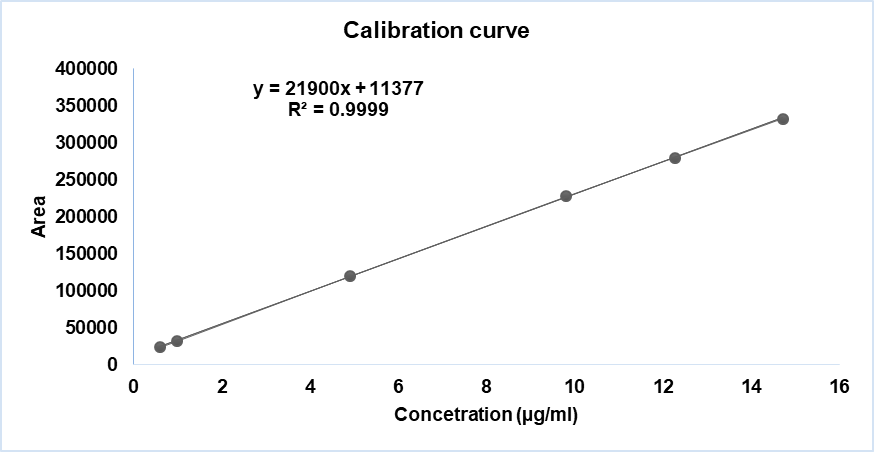
Fig. 9: Linearity curve report of DRC-A
Table 7: Results for linearity of diphenhydramine hydrochloride
| Sample # | Linearity level | Concentration (µg/ml) | Area |
| 1 | LOQ | 0.65 | 16134 |
| 2 | 10 % | 201.59 | 4147601 |
| 3 | 50 % | 1007.95 | 19700076 |
| 4 | 100% | 2015.89 | 37543860 |
| 5 | 125% | 2519.87 | 45412552 |
| 6 | 150% | 3023.84 | 52660652 |
| Co-efficient of correlation | 0.997717 | ||
| Intercept | 9034030.940 | ||
| Slope | 17567.158 | ||
| Bias @100% | 2.4 |
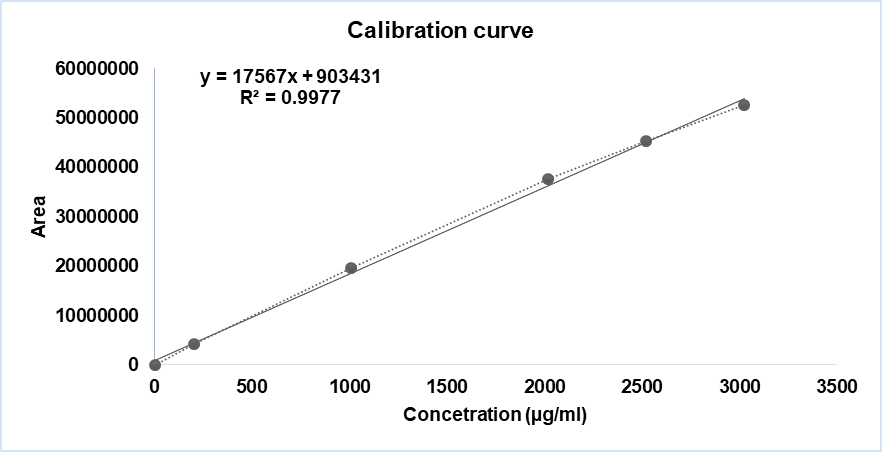
Fig. 10: Linearity curve report of diphenhydramine hydrochloride
Table 8: Results for linearity of DNO
| Sample# | Linearity level | Concentration (µg/ml) | Area |
| 1 | LOQ | 0.66 | 9341 |
| 2 | 10 % | 6.07 | 108474 |
| 3 | 50 % | 30.36 | 551974 |
| 4 | 100% | 60.72 | 1106163 |
| 5 | 125% | 75.90 | 1359752 |
| 6 | 150% | 91.08 | 1592662 |
| Co-efficient of correlation | 0.999289 | ||
| Intercept | 7008.124 | ||
| Slope | 17698.241 | ||
| Bias @100% | 0.6 |
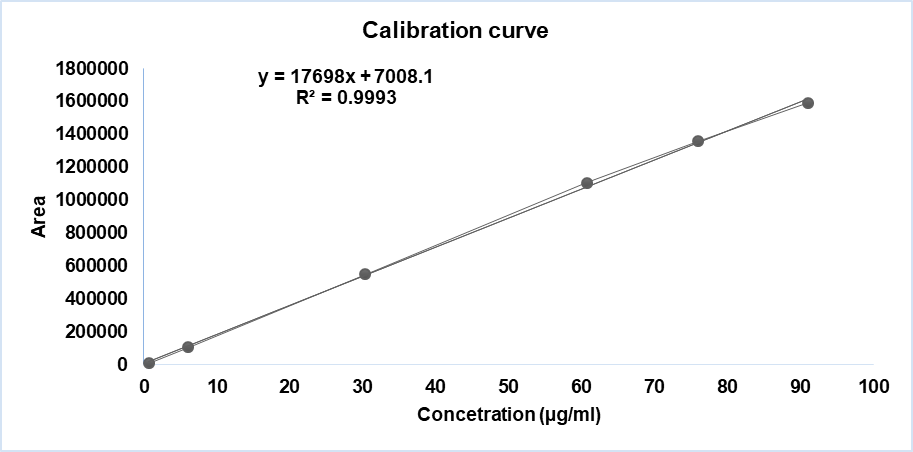
Fig. 11: Linearity curve report of DNO
Table 9: Results for linearity of benzhydrol
| Sample # | Linearity level | Concentration (µg/ml) | Area |
| 1 | LOQ | 0.65 | 22108 |
| 2 | 10 % | 4.05 | 130205 |
| 3 | 50 % | 20.23 | 662204 |
| 4 | 100% | 40.46 | 1293329 |
| 5 | 125% | 50.58 | 1613841 |
| 6 | 150% | 60.69 | 1891165 |
| Co-efficient of correlation | 0.999539 | ||
| Intercept | 11275.680 | ||
| Slope | 31389.097 | ||
| Bias @100% | 0.9 |
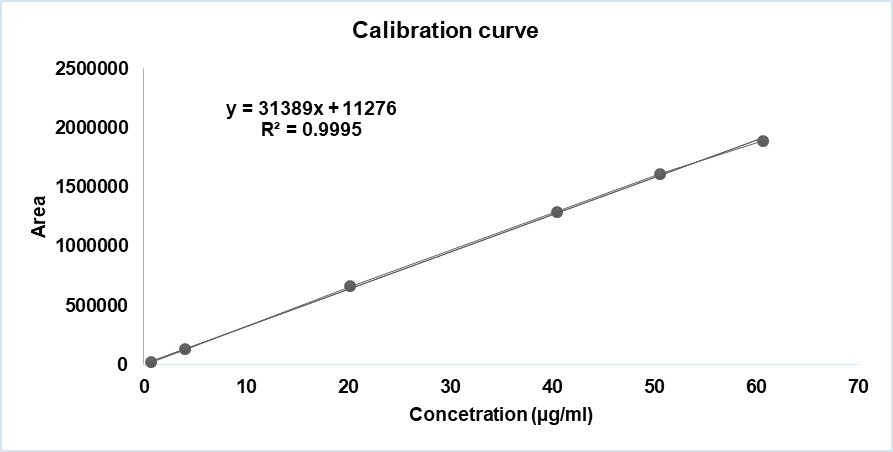
Fig. 12: Linearity curve report of benzhydrol
Table 10: Results for linearity of benzophenone
| Sample # | Linearity level | Concentration (µg/ml) | Area |
| 1 | LOQ | 0.66 | 11568 |
| 2 | 10 % | 0.82 | 14642 |
| 3 | 50 % | 4.10 | 76563 |
| 4 | 100% | 8.20 | 155360 |
| 5 | 125% | 10.25 | 190909 |
| 6 | 150% | 12.30 | 222424 |
| Co-efficient of correlation | 0.999007 | ||
| Intercept | 588.072 | ||
| Slope | 18385.290 | ||
| Bias @100% | 0.4 |
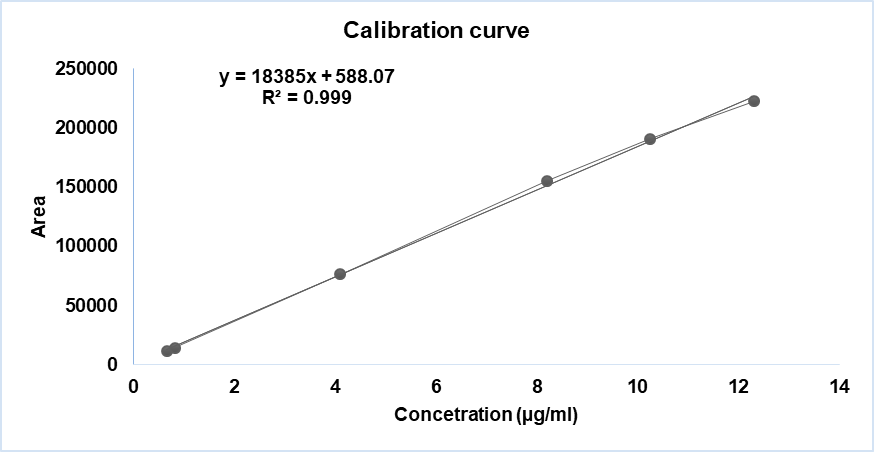
Fig. 13: Linearity curve report of benzophenone
Acceptance criteria
The correlation coefficient of diphenhydramine hydrochloride and known impurities should not be less than 0.98.
The correlation coefficient of diphenhydramine hydrochloride, DRC-A, DNO, benzhydrol and benzophenone was determined as 0.9977, 0.9999, 0.9993, 0.9993 and 0.9995, respectively which is significant from other research studies on diphenhydramine hydrochloride assay and related substance analysis on different dosage forms i. e. tablets and oral solutions [6,12]. Hence, the linear relationship between analyte concentration and responses ensures the linearity of the method for all analyte peaks.
LOD and LOQ
Acceptance criteria
The signal-to-noise ratio for the predicted LOQ level shall not be less than 10.
The predicted LOQ level of diphenhydramine hydrochloride, DRC-A, DNO, benzhydrol and benzophenone was established as 0.0325%, 0.03330%, 0.0320%, 0.0320% and 0.0330%, respectively. Furthermore, the LOD level was established as 0.0010%, 0.0005%, 0.0015%, 0.0030% and 0.0130% for diphenhydramine hydrochloride, DRC-A, DNO, benzhydrol and benzophenone respectively. Hence, it shows the method can detect very low concentration of impurities i. e. ranging from 0.01 µg/ml to 0.26 µg/ml better than other research studies from Kirkpatrick D et al. for diphenhydramine hydrochloride impurities quantification [6]. Hence, the method has potential to quantify impurities at very low level.
Acceptance criteria
The % individual recovery and % average recovery of all samples should be between 80.0% to 120.0%.
The % average recovery for diphenhydramine hydrochloride, DRC-A, DNO, benzhydrol and benzophenone obtained as 97.7%, 100.5%, 88.8%, 107.5% and 112.9% respectively.
Furthermore, the % individual recovery at 100% level found well within the acceptance criteria. The results are comparable with other research study on the quantification of impurities for diphenhydramine hydrochloride [6]. Thus, it shows the method has capability to produce accurate results.
Table 11: Results for LOD establishment (by S/N ratio method)
| Name of the peak | Concentration in % | Concentration in µg/ml | LOD (S/N) |
| DRC-A | 0.0005 | 0.01 | 2.66 |
| Diphenhydramine hydrochloride | 0.0010 | 0.02 | 6.98 |
| DNO | 0.0015 | 0.03 | 6.10 |
| Benzhydrol | 0.0030 | 0.06 | 8.05 |
| Benzophenone | 0.0130 | 0.26 | 8.34 |
Table 12: Results for LOQ establishment (by S/N ratio method)
| Name of the peak | Concentration in % | Concentration in µg/ml | LOQ (S/N) |
| DRC-A | 0.0330 | 0.66 | 155.36 |
| Diphenhydramine hydrochloride | 0.0325 | 0.65 | 148.81 |
| DNO | 0.0320 | 0.64 | 97.82 |
| Benzhydrol | 0.0320 | 0.64 | 63.32 |
| Benzophenone | 0.0330 | 0.66 | 18.31 |
Table 13: Results of accuracy at 100% level for known impurities (RD18009)
| Impurity | Sample # | ‘µg/ml’ added | ‘µg/ml’ found | % Recovery |
| DRC-A | 1 | 10.02 | 10.08 | 100.6 |
| 2 | 10.02 | 10.14 | 101.2 | |
| 3 | 10.02 | 10.03 | 100.1 | |
| 4 | 10.02 | 10.07 | 100.5 | |
| 5 | 10.02 | 10.08 | 100.6 | |
| 6 | 10.02 | 9.99 | 99.7 | |
| Mean* | 100.5±0.509 | |||
| DNO | 1 | 59.58 | 52.87 | 88.7 |
| 2 | 59.58 | 52.85 | 88.7 | |
| 3 | 59.58 | 53.03 | 89.0 | |
| 4 | 59.58 | 53.04 | 89.0 | |
| 5 | 59.58 | 53.21 | 89.3 | |
| 6 | 59.58 | 52.62 | 88.3 | |
| Mean* | 88.8±0.344 | |||
| Benzhydrol | 1 | 39.99 | 43.35 | 108.4 |
| 2 | 39.99 | 43.10 | 107.8 | |
| 3 | 39.99 | 42.60 | 106.5 | |
| 4 | 39.99 | 42.82 | 107.1 | |
| 5 | 39.99 | 43.00 | 107.5 | |
| 6 | 39.99 | 42.98 | 107.5 | |
| Mean* | 107.5±0.641 | |||
| Benzophenone | 1 | 8.13 | 9.14 | 112.4 |
| 2 | 8.13 | 9.18 | 112.9 | |
| 3 | 8.13 | 9.30 | 114.4 | |
| 4 | 8.13 | 9.10 | 111.8 | |
| 5 | 8.13 | 9.17 | 112.8 | |
| 6 | 8.13 | 9.19 | 113.1 | |
| Mean* | 112.9±0.867 |
*Data is given as mean±SD (n = 6), SD (Standard Deviation)
Table 14: Table of results of accuracy for unknown impurity (Batch # RD19006P)
| Batch # | Sample # | ‘µg/ml’ added | ‘µg/ml’ found | % recovery of diphenhydramine |
| RD19006P | 1 | 20.0540 | 19.5773 | 97.6 |
| 2 | 20.0540 | 19.6756 | 98.1 | |
| 3 | 20.0540 | 19.4871 | 97.2 | |
| 4 | 20.0540 | 19.6476 | 98.0 | |
| 5 | 20.0540 | 19.5745 | 97.6 | |
| 6 | 20.0540 | 19.5672 | 97.6 | |
| Mean* | 97.7±0.325 |
*Data is given as mean±SD (n = 6), SD (Standard Deviation)
Table 15: Results of benchtop stability of standard solution
| Time in days | Similarity factor |
| DRC-A | |
| BT | |
| 1 | 0.98 |
| 2 | 1.00 |
| 7 | 0.96 |
Acceptance criteria
The standard is considered stable if the similarity factor is in the range of 0.95 to 1.05.
Individual impurity-If the specification limit is less than or equal to 0.10% the variation shall not be more than 0.03±30% of relative. If the specification limit is more than 0.10% and less than 0.50% the variation shall be within±20%. If the % impurity is>0.50% the variation shall be within±10%.
Total impurities-If total impurity is between 0.10% and 0.50% the allowable variation shall be within±25% of the relative and if total impurity is more than 0.50% the allowable variation shall be within±15%.
The similarity factor for standard is determined as 0.96 and 0.97 for DRC-A at BT and refrigerated condition and 1.00 for diphenhydramine hydrochloride at BT and refrigerated condition. Thus, standard is stable up to 7 days on BT and refrigerated condition, which is better than other research studies from Mallampati RLR et al. for Docetaxel in parenteral formulation organic impurities quantification [16].
The % difference in impurity is within the acceptance criteria; hence, the Sample of Batch # RD18009 is stable up to 7 days on BT and refrigerated condition.
Acceptance criteria
Individual impurity-If the specification limit is less than or equal to 0.10% the variation shall not be more than 0.03±30% of relative. If the specification limit is more than 0.10% and less than 0.50% the variation shall be within±20%. If the % impurity is>0.50% the variation shall be within±10%.
Total impurities-If total impurity is between 0.10% and 0.50% the allowable variation shall be within±25% of the relative and if total impurity is more than 0.50% the allowable variation shall be within±15%.
The % difference in impurity for filtered (Nylon and PVDF filters) and unfiltered solutions is within the acceptance criteria. Hence, both filters are acceptable for the determination of related substance method.
Table 16: Results of bench top stability of test preparation (Batch # RD18009)
| Impurity | Initial | 24h BT | % Difference | Limit from initial | |||
| Sample-1 | Sample-2 | Sample-1 | Sample-2 | Sample-1 | Sample-2 | ||
| DRC-A | 0.517 | 0.509 | 0.509 | 0.507 | 1.5 | 1.0 | ±20% |
| DNO | 2.611 | 2.556 | 2.649 | 2.569 | -1.5 | -0.5 | ±10% |
| Benzhydrol | 2.111 | 2.056 | 2.14 | 2.073 | -1.4 | -0.8 | ±10% |
| Benzophenone | 0.444 | 0.437 | 0.465 | 0.432 | -4.7 | 1.1 | ±20% |
| Single maximum unknown Imp | 0.067 | 0.066 | 0.068 | 0.066 | -1.5 | 0.0 | ±30% |
| Total Impurities | 5.81 | 5.68 | 5.88 | 5.69 | -1.2 | -0.2 | ±15% |
| Impurity | Initial | 48h BT | % Difference | Limit from initial | |||
| Sample-1 | Sample-2 | Sample-1 | Sample-2 | Sample-1 | Sample-2 | ||
| DRC-A | 0.517 | 0.509 | 0.525 | 0.513 | -1.5 | -0.8 | ±20% |
| DNO | 2.611 | 2.556 | 2.648 | 2.570 | -1.4 | -0.5 | ±10% |
| Benzhydrol | 2.111 | 2.056 | 2.173 | 2.095 | -2.9 | -1.9 | ±10% |
| Benzophenone | 0.444 | 0.437 | 0.474 | 0.449 | -6.8 | -2.7 | ±20% |
| Single maximum unknown Imp | 0.067 | 0.066 | 0.069 | 0.067 | -3.0 | -1.5 | ±30% |
| Total Impurities | 5.81 | 5.68 | 5.95 | 5.74 | -2.4 | -1.1 | ±15% |
| Impurity | Initial | 7 Days BT | % Difference | Limit from initial | |||
| Sample-1 | Sample-2 | Sample-1 | Sample-2 | Sample-1 | Sample-2 | ||
| DRC-A | 0.517 | 0.509 | 0.506 | 0.494 | 2.1 | 2.9 | ±20% |
| DNO | 2.611 | 2.556 | 2.626 | 2.562 | -0.6 | -0.2 | ±10% |
| Benzhydrol | 2.111 | 2.056 | 2.131 | 2.059 | -0.9 | -0.1 | ±10% |
| Benzophenone | 0.444 | 0.437 | 0.458 | 0.435 | -3.2 | 0.5 | ±20% |
| Single maximum unknown Imp | 0.067 | 0.066 | 0.068 | 0.066 | -1.5 | 0.0 | ±30% |
| Total Impurities | 5.81 | 5.68 | 5.84 | 5.66 | -0.5 | -0.4 | ±15% |
Table 17: Results of refrigerated stability of test preparation (Batch # RD18009)
| Impurity | Initial | 24h REF | % Difference | Limit from Initial | |||
| Sample-1 | Sample-2 | Sample-1 | Sample-2 | Sample-1 | Sample-2 | ||
| DRC-A | 0.517 | 0.509 | 0.510 | 0.503 | 1.4 | 1.2 | ±20% |
| DNO | 2.611 | 2.556 | 2.635 | 2.564 | -0.9 | -0. | ±10% |
| Benzhydrol | 2.111 | 2.056 | 2.134 | 2.067 | -1.1 | -0.5 | ±10% |
| Benzophenone | 0.444 | 0.437 | 0.460 | 0.437 | -3.6 | 0.0 | ±20% |
| Single maximum unknown Imp | 0.067 | 0.066 | 0.068 | 0.066 | -1.5 | 0.0 | ±30% |
| Total Impurities | 5.81 | 5.68 | 5.86 | 5.068 | -0.9 | 0.0 | ±15% |
| Impurity | Initial | 48hREF | % Difference | Limit from Initial | |||
| Sample-1 | Sample-2 | Sample-1 | Sample-2 | Sample-1 | Sample-2 | ||
| DRC-A | 0.517 | 0.509 | 0.520 | 0.514 | -0.6 | -1.0 | ±20% |
| DNO | 2.611 | 2.556 | 2.638 | 2.577 | -1.0 | -0.8 | ±10% |
| Benzhydrol | 2.111 | 2.056 | 2.166 | 2.100 | -2.6 | -2.1 | ±10% |
| Benzophenone | 0.444 | 0.437 | 0.473 | 0.450 | -6.5 | -3.0 | ±20% |
| Single maximum unknown Imp | 0.068 | 0.066 | 0.068 | 0.067 | -1.5 | -1.5 | ±30% |
| Total Impurities | 5.81 | 5.68 | 5.92 | 5.76 | -1.9 | -1.4 | ±15% |
| Impurity | Initial | 7 Days REF | % Difference | Limit from Initial | |||
| Sample-1 | Sample-2 | Sample-1 | Sample-2 | Sample-1 | Sample-2 | ||
| DRC-A | 0.517 | 0.509 | 0.502 | 0.493 | 2.9 | 3.1 | ±20% |
| DNO | 2.611 | 2.556 | 2.606 | 2.559 | 0.2 | -0.1 | ±10% |
| Benzhydrol | 2.111 | 2.056 | 2.112 | 2.05 | 0.0 | 0.3 | ±10% |
| Benzophenone | 0.444 | 0.437 | 0.460 | 0.435 | -3.6 | 0.5 | ±20% |
| Single maximum unknown Imp | 0.067 | 0.066 | 0.067 | 0.066 | 0.0 | 0.0 | ±30% |
| Total Impurities | 5.81 | 5.68 | 5.8 | 5.65 | 0.2 | 0.5 | ±15% |
Table 18: Results for filters (Batch #RD18009)
| Impurity | Unfiltered Nylon | 0.45µm Nylon filter | % Difference | Acceptance Limits | |||
| Sample-1 | Sample-2 | Sample-1 | Sample-2 | Sample-1 | Sample-2 | ||
| DRC-A | 0.462 | 0.512 | 0.461 | 0.510 | 0.2 | 0.4 | ±20% |
| DNO | 2.350 | 2.593 | 2.344 | 2.593 | 0.3 | 0.0 | ±10% |
| Benzhydrol | 1.862 | 2.064 | 1.857 | 2.064 | 0.3 | 0.0 | ±10% |
| Benzophenone | 0.406 | 0.438 | 0.401 | 0.433 | 1.2 | 1.1 | ±20% |
| Single maximum unknown impurity | 0.068 | 0.068 | 0.067 | 0.068 | 1.5 | 0.0 | ±30% |
| Total Impurities | 5.20 | 5.75 | 5.18 | 5.73 | 0.4 | 0.3 | ±15% |
| Impurity | Unfiltered PVDF | 0.45µm PVDF filter | % Difference | Acceptance Limits | |||
| Sample-1 | Sample-2 | Sample-1 | Sample-2 | Sample-1 | Sample-2 | ||
| DRC-A | 0.451 | 0.461 | 0.447 | 0.458 | 0.9 | 0.7 | ±20% |
| DNO | 2.291 | 2.334 | 2.280 | 2.333 | 0.5 | 0.0 | ±10% |
| Benzhydrol | 1.826 | 1.879 | 1.826 | 1.879 | 0.0 | 0.0 | ±10% |
| Benzophenone | 0.389 | 0.401 | 0.386 | 0.400 | 0.8 | 0.2 | ±20% |
| Single maximum unknown impurity | 0.064 | 0.068 | 0.063 | 0.067 | 1.6 | 1.5 | ±30% |
| Total Impurities | 5.07 | 5.21 | 5.05 | 5.18 | 0.4 | 0.4 | ±15% |
CONCLUSION
The analytical method is quite simple and suitable for finished product analysis. It shows the sensitivity and capability of the method to produce precise and accurate results for the detection and quantification of very low level of impurities. The method was validated according to ICH guidelines for (Q2) analytical method validation and produces specific, precise, linear and accurate results. Thus, the method shows potential application of detection and quantification of the impurities of diphenhydramine hydrochloride from different dosage forms. Additionally, it shows the capability to produce accurate results for all known impurity, including the degradation impurity, which makes it more suitable for stability-indicating analysis. This research study shows its significance over other due to very rare and/or unavailability of study materials on soft gel capsule dosage form for diphenhydramine hydrochloride. Hence, the related substance by HPLC for diphenhydramine hydrochloride soft gel capsule is suitable for finished product analysis as well as stability analysis in quality control.
ACKNOWLEDGMENT
The Author would like to acknowledge the support of Apnar Pharma LLP for their consent on the development and publication of the research work.
FUNDING
Nil
ABBREVIATIONS
RSD: Relative Standard Deviation, SD: Standard Deviation, SST: System suitability Solution, DRC-A: Diphenhydramine Related Compound-A, DNO: Diphenhydramine N –Oxide, LOQ: Limit of Quantification, LOD: Limit of Detection, WS: Working standard, RS: Reference standard, NA: Not Applicable, RT: Retention time, USP: United States Pharmacopeia, NMT: Not more than, NLT: Not less than, RRT: Relative Retention time, BT: Bench Top
CONFLICT OF INTERESTS
Author declares that there is no conflict of interest.
AUTHORS CONTRIBUTIONS
The Author Chinmaykumar Oza carried out the development and Validation of method, drafted, edited and approved the manuscript.
REFERENCES
Sicari V, Zabbo CP. Diphenhydramine. In: Treasure Island, (FL): StatPearls Publishing; 2023. p. 2025. Available from: https://www.ncbi.nlm.nih.gov/books/NBK526010.
Sulistiyo J. Assay of diphenhydramine HCl in syrup by high performance liquid chromatography. J Drug Deliv Ther. 2023 Jun 15;13(6):141-4. doi: 10.22270/jddt.v13i6.5885.
PubChem. Bethesda (MD): National Library of Medicine (US). National Center for Biotechnology Information. Compound Summary for CID 8980, Diphenhydramine Hydrochloride; 2004. Available from: https://pubchem.ncbi.nlm.nih.gov/compound/Diphenhydramine-Hydrochloride. [Last accessed on 27 Jan 2025].
Gomez MR, Olsina RA, Martinez LD, Silva MF. Simultaneous determination of dextromethorphan, diphenhydramine and phenylephrine in expectorant and decongestant syrups by capillary electrophoresis. J Pharm Biomed Anal. 2002;30(3):791-9. doi: 10.1016/S0731-7085(02)00362-X, PMID 12367705.
Bratty M, Manoharan G. Simultaneous estimation of diphenhydramine hydrochloride and naproxen sodium in raw and tablet formulation by reverse phase-high-performance liquid chromatographic method. IRJPAC. 2016;13(2):1-9. doi: 10.9734/IRJPAC/2016/30189.
Kirkpatrick D, Fain M, Yang J, Santos L, Anthony C. UHPLC assay and impurity methods for diphenhydramine and phenylephrine hydrochloride oral solution. Sep Sci Plus. 2020 Jan;3(1-2):4-11. doi: 10.1002/sscp.201900084, PMID 32076656, PMCID PMC7029815.
International Council for Harmonisation (ICH) of technical requirements for pharmaceuticals for human use. Vol. Q8(R2). Geneva, Switzerland: International Council for Harmonisation (ICH) of Technical Requirements for Pharmaceuticals for Human Use. Pharmaceutical Development; 2009. Available from: https://database.ich.org/sites/default/files/Q8%28R2%29%20Guideline.pdf. [Last accessed on 30 Jan 2025]
United States pharmacopoeia and national formulary (USP-NF). Diphenhydramine hydrochloride capsule. Rockville, MD: United States Pharmacopeial Convention; 2024. Available from: https://online.uspnf.com/uspnf/document/1_GUID-919A936F-FE54-4DC1-9B12-CF3E76E1968D_2_en-US. [Last accessed on 30 Jan 2025].
International Council for Harmonisation (ICH) of technical requirements for pharmaceuticals for human use guideline. Validation Anal Procedures Q. Geneva, Switzerland: International Council for Harmonisation (ICH) of Technical Requirements for Pharmaceuticals for Human Use; 2023. Available from: https://www.ich.org/page/quality-guidelines.
Kauser R, Padavala SK, Palanivel V. Optimization of LC-MS/MS method for the simultaneous determination of metformin and rosiglitazone in human plasma with box-behnken design. Int J Appl Pharm. 2024 Nov 7;16(6):98-105. doi: 10.22159/ijap.2024v16i6.51936.
Manoranjani M, Satyadev TN, David Raju MD. A reverse phase ultra-performance liquid chromatography-photo diode array estimation of captopril and hydrochlorothiazide in bulk and pharmaceutical dosage form. Int J Appl Pharm. 2024 Jul 7;16(4):267-74. doi: 10.22159/ijap.2024v16i4.49857. Available from: https://www.journals.innovareacademics.in/index.php/ijap/article/view/49857.
Zagorodniy SL, Vasyuk SO. Validation of quantitative determination methods of diphenhyramine tablets by high-performance liquid chromatography. Zaporozhye Med J. 2015;17(2). doi: 10.14739/2310-1210.2015.2.42122.
Bhavya SK, Srija G. Reverse-phase high-performance liquid chromatography method development and validation for the quantification of sugammadex in bulk and pharmaceutical dosage form. Asian Journal of Pharmaceutical and Clinical Research. 2024;17(7):87-90.
Bhaskararao P, Sarika M, Madhavi CL, Kollipara MG, Prashanthi G. The industrial importance of technology transfer for analytical method development and validation-application to vilazodone hydrochloride dosage form. Int J Chem Res. 2024 Oct 1;8(4):12-7. doi: 10.22159/ijcr.2024v8i4.235.
United states pharmacopoeia and national formulary (USP-NF). Diphenhydramine hydrochloride. Rockville, MD: United States Pharmacopeial Convention; 2024. Available from: https://online.uspnf.com/uspnf/document/1_GUID-67E581CC-E9F4-4595-BD84-EBDB8821DF4E_4_en-US. [Last accessed on 30 Jan 2025].
Mallampati RL, Reddy JB. Development and validation of RP-HPLC method for the quantitative determination of organic impurities of docetaxel in parenteral formulation of docetaxel using UV detector. Asian Journal of Pharmaceutical and Clinical Research. 2024;17(9):54-63.