
Int J Pharm Pharm Sci, Vol 17, Issue 8, 35-45Original Article
PRE-PROCESSING TECHNIQUES FOR INTEGRATED ADVERSE DRUG REACTION DATASETS
SHIKSHA DUBEY*, SHIRSHENDU MAITRA
Department of Computer Application, Thakur Institute of Management, Career Development and Research (TIMSCDR), Mumbai-400101, India
*Corresponding author: Shiksha Dubey; *Email: shiksha.dubey@timscdrmumbai.in
Received: 12 Apr 2025, Revised and Accepted: 17 Jun 2025
ABSTRACT
Objective: To integrate and preprocess datasets from the FDA adverse event reporting system (FAERS), side effect resource (SIDER), DrugBank, and PubChem to extract meaningful insights into drug interactions, adverse events, and molecular properties, thereby supporting drug discovery and pharmacovigilance.
Methods: The study implements a preprocessing pipeline that includes data cleaning, normalization, and harmonization to ensure consistency across the diverse datasets. Standardization of drug nomenclature and handling of missing or inconsistent information are emphasized. The integrated data is then subjected to exploratory data analysis and advanced visualization techniques to uncover patterns and correlations within the data.
Results: The integration and preprocessing of the datasets improved the consistency and quality of the drug-related data. Exploratory analysis revealed patterns and potential associations among drugs, adverse events, and molecular features. Visualization tools effectively conveyed complex relationships and significant trends, enhancing interpretability.
Conclusion: The study successfully demonstrates that integrating and preprocessing multiple drug-related datasets improves data quality and facilitates comprehensive analysis. The resulting resource supports better-informed decision-making in drug development and pharmacovigilance by enabling a deeper understanding of drug interactions and safety profiles.
Keywords: Adverse drug reactions (ADRs), Drugs, Pharmacology
© 2025 The Authors. Published by Innovare Academic Sciences Pvt Ltd. This is an open access article under the CC BY license (https://creativecommons.org/licenses/by/4.0/)
DOI: https://dx.doi.org/10.22159/ijpps.2025v17i8.54565 Journal homepage: https://innovareacademics.in/journals/index.php/ijpps
INTRODUCTION
The safety of drugs is the major goal of the healthcare and pharmaceutical industry today [1]. The correct dosage and proper care are important for improving health and enhancing human well-being. In the current scenario, all the drugs developed have associated risks. Only drugs with a greater therapeutic effect than the associated risk are prescribed as medicines. ADRs are drug-related, unwanted, undesired effects on human health. The Adverse Drug Reactions are categorized to be part of Adverse Drug Events, which is again included in the subcategory of medication errors as shown in fig. 1.
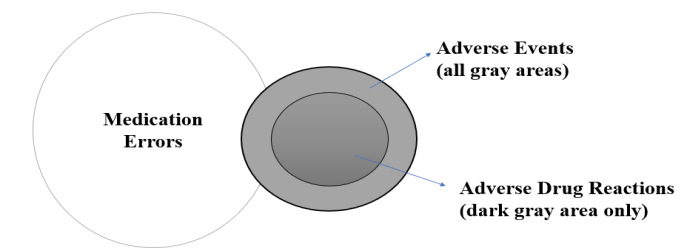
Fig. 1: Framework to categorize adverse drug reaction
ADR, as per the International Council for Harmonization (ICH) definition, refers to "all harmful and unintended responses to a medicinal product at any dose [2, 3]". This definition implies a potential causal link between the medicinal product and the adverse reaction. Since most drugs undergo clinical testing before market release [4], ADRs primarily manifest during the post-marketing phase of their lifecycle. These adverse reactions constitute a major cause of human mortality and morbidity. Studies indicate that ADRs contribute significantly to hospitalization and rank as the fifth leading reason for mortality in hospitals [5]. Increased healthcare costs and prolonged hospital stays account for the severity of ADRs.
Numerous factors contribute to the occurrence of ADRs in humans, categorized as related to the patient, drug, and the environment. Patient-related factors include age and gender, crucial in assessing individual susceptibility to ADRs. Drug-related factors encompass dosage and interactions with other medications. Social factors like smoking and alcohol consumption also influence ADR development, underscoring their significance in enhancing patient safety and healthcare analysis [6]. The history of ADR research dates back to notable incidents like the "Sulphanilamide Disaster" in the USA in 1937, which led to over 100 deaths from renal failure, and the "Thalidomide Disaster “ Germany 1957, causing severe birth defects like phocomelia [7, 8]. These events prompted the establishment of ADR monitoring centers worldwide to monitor and report adverse drug reactions effectively.
Literature review
Various techniques are currently employed to preprocess unstructured adverse drug reaction (ADR) data for research purposes. Friedrich et al. [9] have extensively detailed normalization techniques using dictionaries. Similarly, Louis et al. [10] encoded ADRs into standardized naming conventions to enhance the performance of machine learning models. Text mining and natural language processing techniques are applied to convert unstructured data into a machine-readable format suitable for training and prediction. Over the past two decades, numerous datasets have been created to document incidents of adverse drug reactions. In this time span, countries have developed pharmacovigilance centers responsible for collecting ADR reports mainly from medical practitioners and healthcare professionals. For post-marketing surveillance of ADRs, these centers play a critical role.
The diagram fig. 2 provides a brief overview of various sources of ADR-related data.
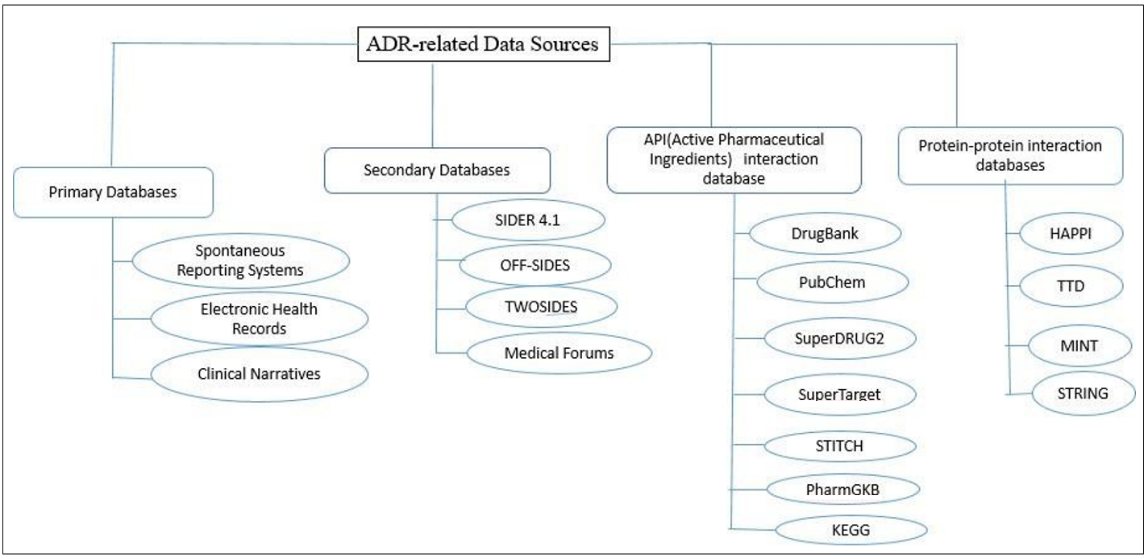
Fig. 2: ADR-related data sources
Varieties of disparate sources are grouped into separate categories. The primary groups defined are primary and secondary data sources. Apart from this, datasets are established by integrating data on proteins, targets, and chemical ingredients of drugs. Datasets have also been created based on protein-protein and genetic interactions with drugs.
MATERIALS AND METHODS
The data sources that were found and the integration of datasets based on IDs and knowledge graphs are covered by the author in the section that follows. The various pre-processing methods used on the integrated dataset are listed and carried out.
Datasource selection
In the above table, a variety of data sources have been specified for ADR analysis. For this research work, the author selects the dataset relevant to the research study.
FDA adverse event reporting system (FAERS)
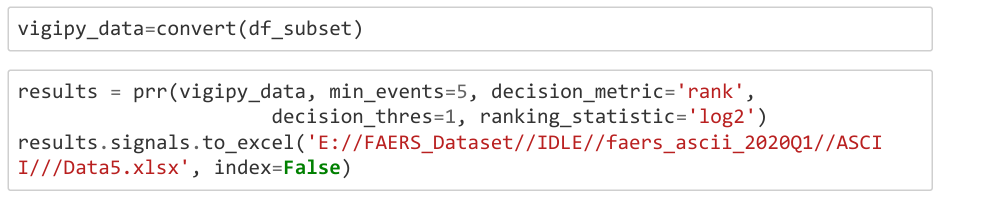
FAERS [11] is a primary resource freely available virtually available on this link (FDA Adverse Event Reporting System (FAERS) Database | FDA). Data collection is done and validated authentically. The dataset is available in both ASCII and CSV formats. In the period of one year from 2019 to 2020, about 3 million data records were downloaded and extracted. FAERS dataset. Initially, the data in the FAERS dataset is confusing and distributed among multiple tables. The data is converted into a comprehensible format and combined using the primary ID and the case ID. Due to the humongous size of the resultant dataset, it is necessary to detect significant drug-ADR associations. These associations are calculated using the Proportional Reporting Ratio (PRR). The association score greater than or equal to 3 is selected for further processing. Finally, the outcome of prior experiments results in a pre-processed FAERS dataset, which is integrated with other data sources. ADR is predicted based on both drug and patient characteristics. The code snippet shows the calculation of the proportionality reporting ratio to detect the most relevant association between drug name and adverse drug reaction. The outcome of this snippet is shown in fig. 3.
Side effect resource (sider)
The SIDER dataset contains information about marketed drugs and their recorded adverse drug reactions. It is easily accessible online as a secondary data source. Additionally, the dataset includes drug indications extracted from package inserts using Natural Language Processing (NLP) [12] techniques. These drug indications help reduce false positives by using medical terms to distinguish ADRs from diseases. SIDER is one of the most widely used datasets in ADR detection and prediction research, appearing in nearly 60% of studies conducted to date [13].
| Drug name | Pt | Count | Expected | Value | PRR | Product IT | Event mar | FDR | |
| NESP | Congenita | 6 | 0.000172 | 6169.58 | 2.10E+12 | 30 | 6 | 3.04E-15 | |
| ORFADIN | Amino aci | S | 0.000391 | 6170.77 | 6.39E+11 | 82 | S | O | |
| ORFADIN | Succinylac | 5 | 0.000391 | 6170.77 | 6.39E+11 | 82 | 5 | 0.229619 | |
| EYLEA | Macular 5 | 15 | 0.003562 | -6170.78 | 6.32E+11 | 249 | 15 | 0.007209 | |
| XALKORI | Myocardia | 5 | 0.002055 | -6172.43 | 1.22E+11 | 431 | 5 | 0.021464 | |
| SOMAVER | Pituitary e | 5 | 0.003109 | 6172.84 | 8.04E+10 | 652 | 5 | 0.085813 |
Fig. 3: ADR detection results
Drug bank data source
The University of Alberta and Metabolomics Innovation Centre, both in Alberta, Canada, are the creators and maintainers of the extensive, publicly available Drug Bank database, which offers data on medications and drug targets [14]. Authorities were convinced that the database would be used ethically, thus, permission was obtained to obtain the full collection. Drug Bank ID, drug_id, and drug-protein targets are the data points that the author chose and pulled from the database, even though they contain important information about pharmaceuticals. Once more, the most used dataset for ADR-based research is Drug Bank. According to research dataset has been used in around 47% of projects. It is paired with the SIDER dataset in the majority of research projects [13].
Pubchem
This database contains information about chemical molecules and their activities against biological assays. Managed by the National Center for Biotechnology Information (NCBI), which is part of the National Library of Medicine under the United States National Institutes of Health (NIH) [15], it is freely accessible online for research purposes. It is the third most commonly used dataset, alongside DrugBank and SIDER, for ADR prediction mechanisms and is included in 25% of ADR-related research studies [13].
The datasets are integrated based on the two integration methods discussed as follows:-
Drug identifier-based integration
The integration begins by merging the DrugBank and SIDER datasets using the DrugBank identifier.
The resulting dataset is then combined with the PubChem dataset through the PubChem identifier.
Subsequently, the integrated dataset is further merged with the FAERS dataset based on the drugs common to both.
Throughout the process, drug names are standardized to common drug IDs, which serve as the basis for dataset integration.
Fig. 4 shows in detail the integration process based on the different datasets available above.
Knowledge graph-based integration [16]
Knowledge graphs are constructed using nodes of different datasets like drugs, target proteins, enzymes, pathways, indications, and adverse drug reactions. In fig. 5, information derived from knowledge graphs is used for identifying side effects as well as detecting probable ADR for the prescribed medicines.
The graph was created using Neo4j, an ACID-compliant graph database developed by Neo4j, Inc., known for its native graph storage and processing capabilities. Integration involved creating nodes for each dataset and linking them through common feature variables. The resulting integrated dataset formed a knowledge graph by combining multiple datasets.
Pre-processing of the dataset
The resultant dataset should be pre-processed for better prediction of adverse drug reactions. The steps involved in this process are discussed in the fig. 6.
A domain expert examined the integrated dataset's attributes and offered insightful commentary that resulted in changes. The features added to the dataset are discussed in table 1.
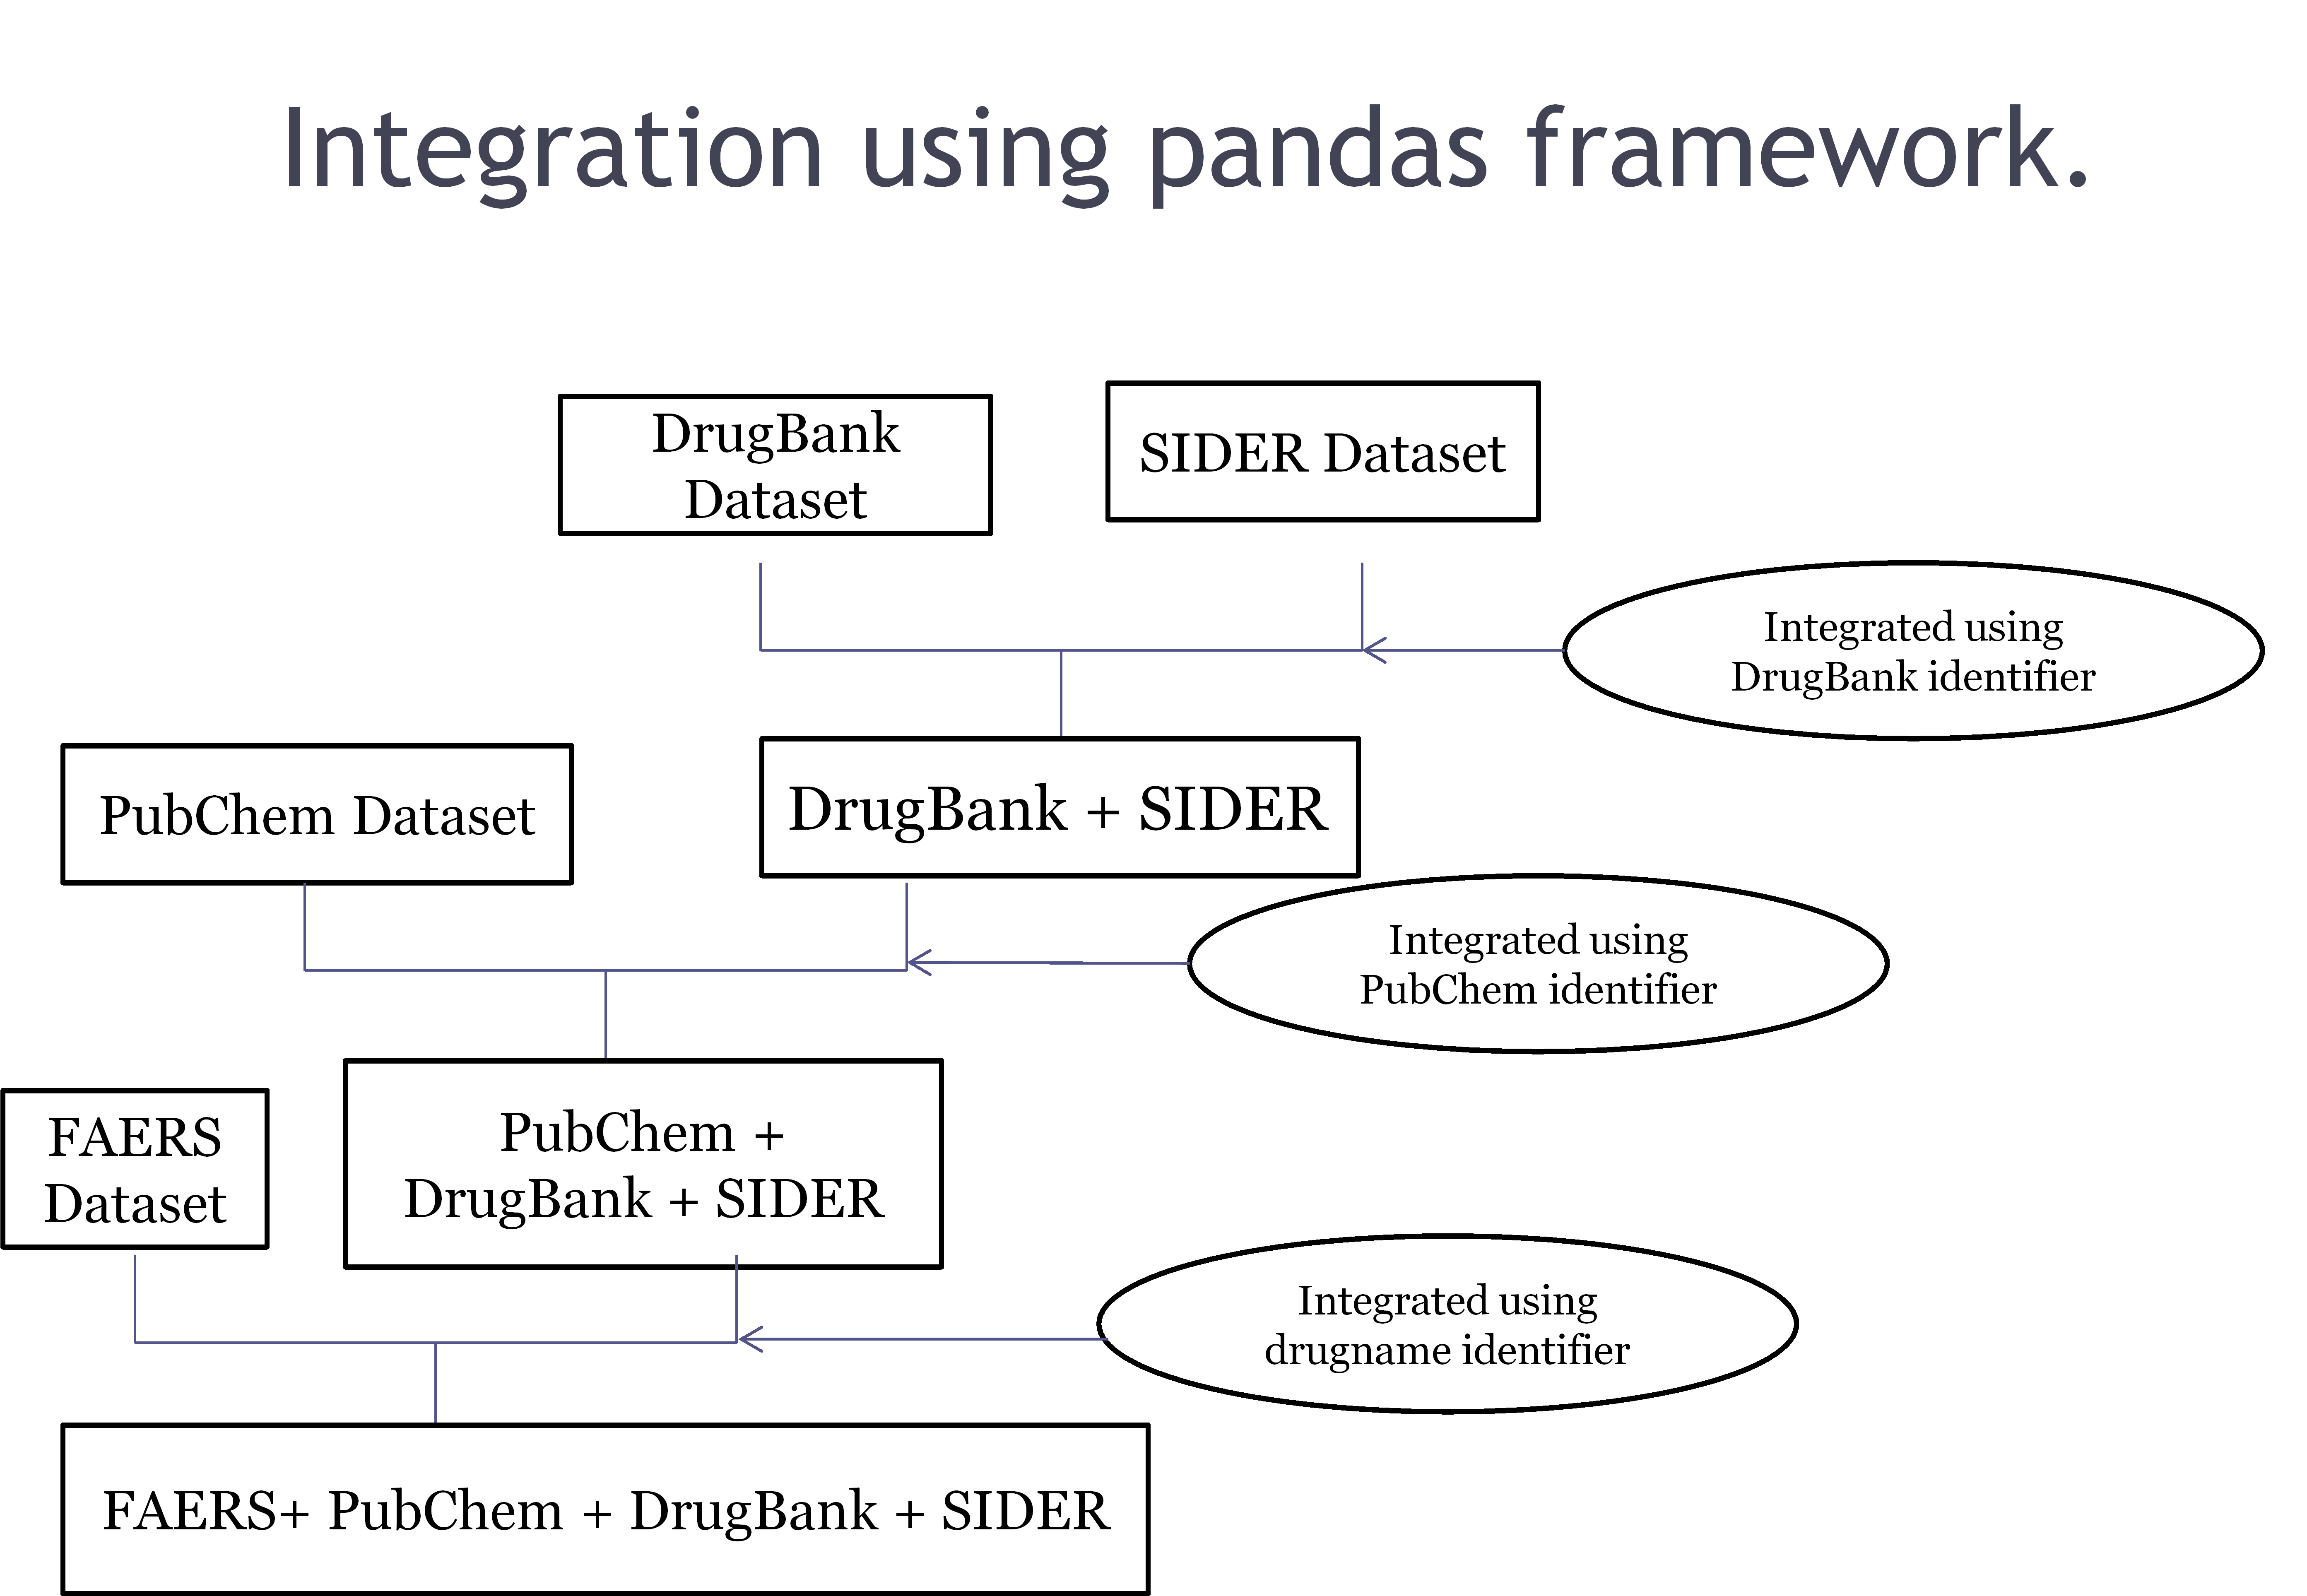
Fig. 4: Dataset integration based on common identifiers
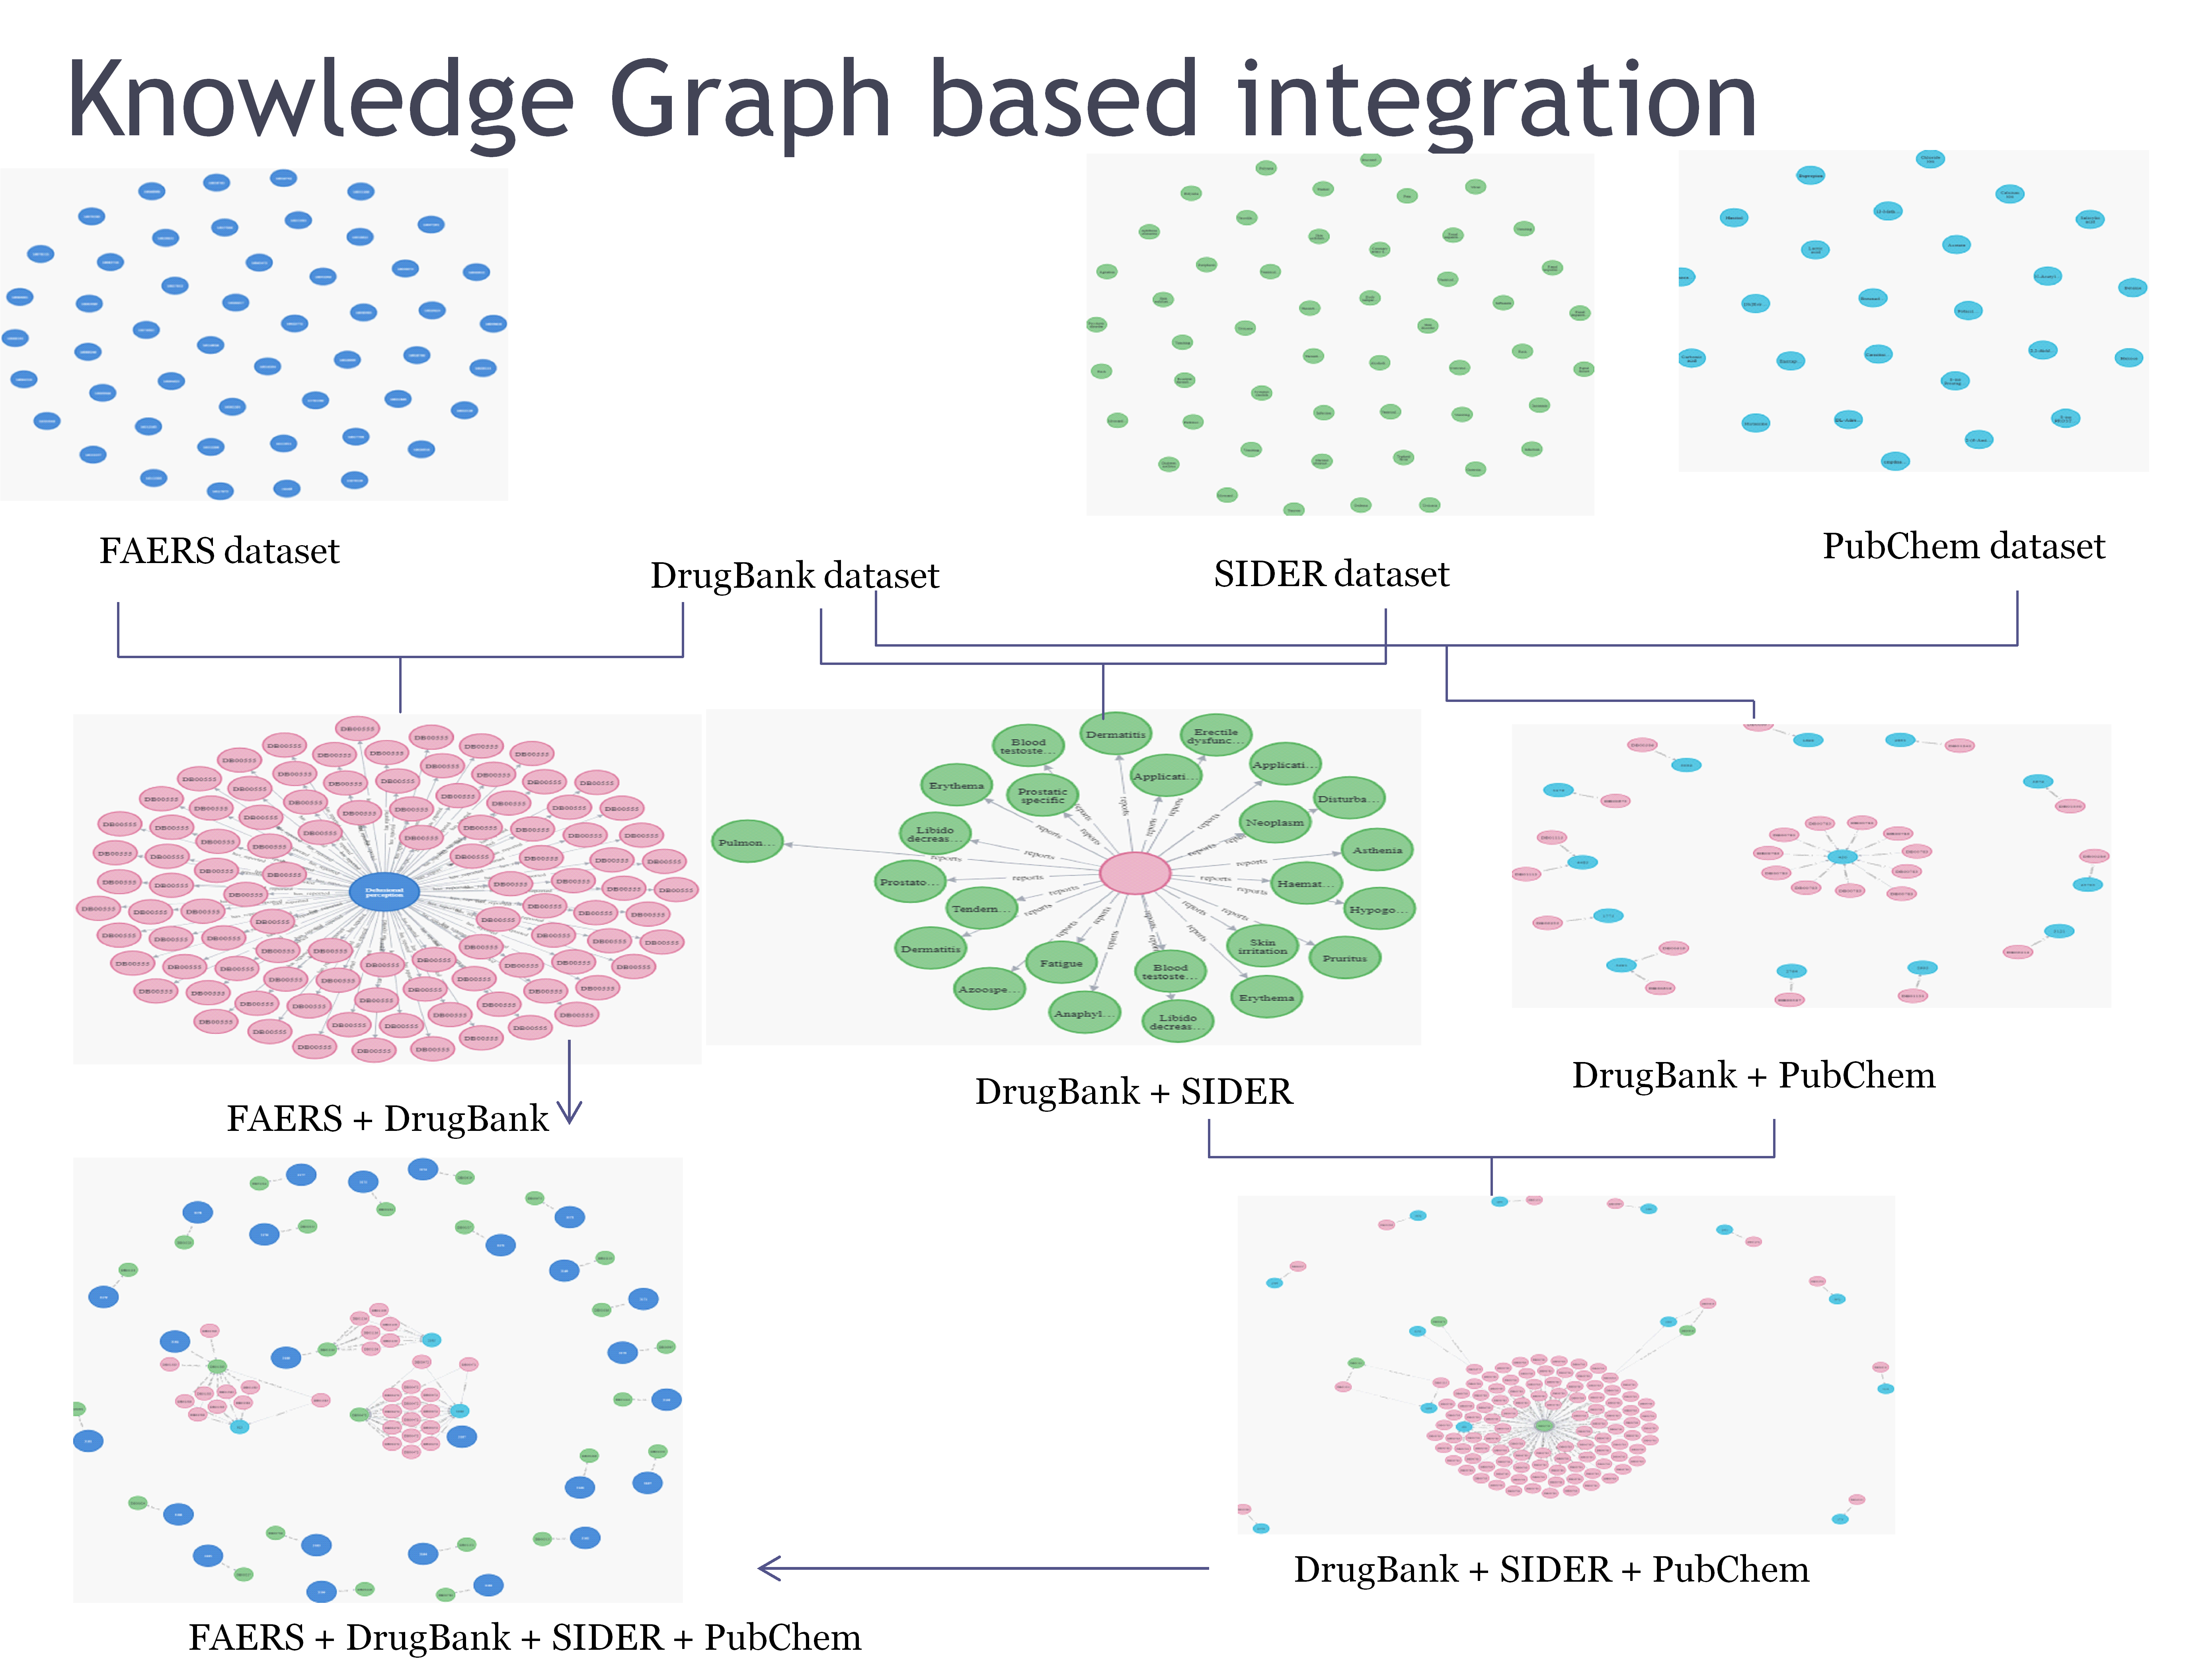
Fig. 5: Knowledge graph Integration
Table 1: Feature variable description
| Feature variable | Description |
| LogP | A drug's lipophilicity is a critical factor that influences how it functions in the human body. A compound's permeability, or the degree to which a medicine may efficiently reach its intended target within the body, is indicated by its Log P value. |
| LogS | A compound's absorption and distribution characteristics are influenced by its water solubility. Avoiding substances with low solubility is the goal because low solubility is typically associated with poor absorption. Our calculated logS value is the solubility's logarithm(base 10) expressed in mol/l. |
| CYP inhibitors | They are responsible for delaying the action of protein targets. By interfering with the normal metabolic pathways, inhibitors can prevent the proper breakdown of drugs, leading to higher concentrations and potential toxicity. This highlights the need for careful management of drug interactions to avoid adverse effects. |
| Toxicity | Toxicity indicates the toxic nature of the drugs. |
Table 2: ADR outcome dataset description
| Drug | Prod ai | mw | Type of target | Sequence | LOGP | LogS | Route | Age | Sex | % | Occrcountry | Role cod | Inhibitor | CYP1A2 inhibitor | CYP2C9 inhibitor | CYP206 inhibitor | CYP3A4 inhibitor | Hepatotoxicity | Indi pt | Pt | Outccod | |
| Count | 4417120 | 4417120 | 4417120 | 4417120 | 4417120 | 4417120 | 4417120 | 4417120 | 4417120 | 4417120 | 4417120 | 4417120 | 4417120 | 4417120 | 4417120 | 4417120 | 4417120 | 4417120 | 4417120 | 4417120 | 4417120 | 4417120 |
| Mean | 43342201 | 41481169 | 263.8751 | 1.182975 | 1.182975 | 1814325 | -2.81306 | 1182975 | 8.589923 | 0.027131 | 5.732451 | 0 | 1182975 | 0 | 0 | 0 | 0.350925 | 0 | 0.643075 | 41682554 | 45321517 | 1.182975 |
| Std | 25880.36 | 5062961 | 75,78298 | 0.117938 | 0.226306 | 0.60612 | 1002245 | 0.055253 | 0.826143 | 0.162455 | 0.820593 | 0 | 0.044308 | 0 | 0 | 0 | 0.47726 | 0 | 0.47726 | 4617478 | 5471305 | 0.903588 |
| Min | 43307004 | 1501778 | 252.27 | 1016575 | 1016575 | 0.99 | -3.55 | 0.857143 | 4 | 0 | 3 | 0 | 1065187 | 0 | 0 | 0 | 0 | 0 | 0 | 35208063 | 45914076 | 0 |
| 25% | 43307004 | 43243823 | 252.27 | 1016575 | 1016575 | 0.99 | -3.55 | 1190424 | % | 0 | $ | 0 | 119'264 | 0 | 0 | 0 | 0 | 0 | 0 | 35208063 | 45914076 | 1 |
| 50% | 43361231 | 43315284 | 252.27 | 1266565 | 1.016575 | 2.26 | -3.55 | 1190424 | % | 0 | 6 | 0 | 1191264 | 0 | 0 | 0 | 0 | 0 | 1 | 42362050 | 45925540 | 1 |
| 75% | 43361231 | 43360256 | 285.34 | 1266565 | 1490751 | 2.26 | -145 | 1190424 | % | 0 | 6 | 0 | 119'264 | 0 | 0 | 0 | 1 | 0 | 1 | 45600543 | 45925540 | 1 |
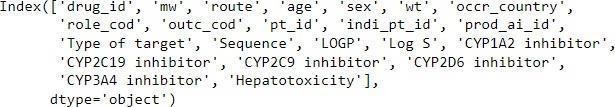
After reviewing the dataset based on the features dropped and added to the existing dataset, the columns of the final integrated dataset specified areas as follows:-
Dataset exploration and visualization
Data exploration is performed to analyze the dataset from different perspectives and get greater insights into the data for further processing. The description of the resultant dataset is shown in table 2.
The dataset has been described in terms of multiple perspectives. The count denotes the total rows in the dataset, while the mean and standard deviation are the average value and variance in each column. The min and max signify the distribution of data in various quartiles.
Univariate analysis
Since the feature variables are the same for both datasets and only the target variables are different, univariate analysis is performed only once for both datasets. The dataset is analyzed, and some important features of the data source are visualized in terms of bar charts and pie charts in table 3.
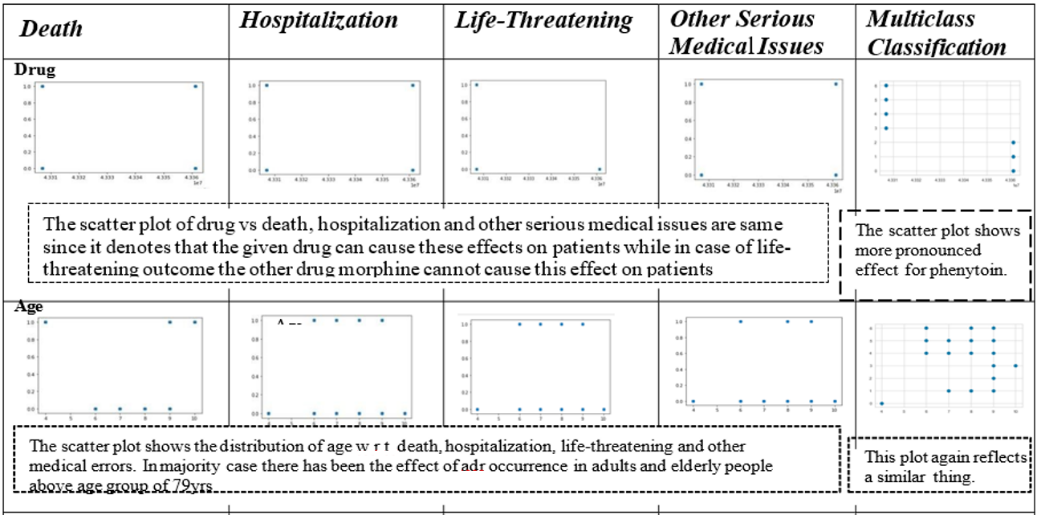
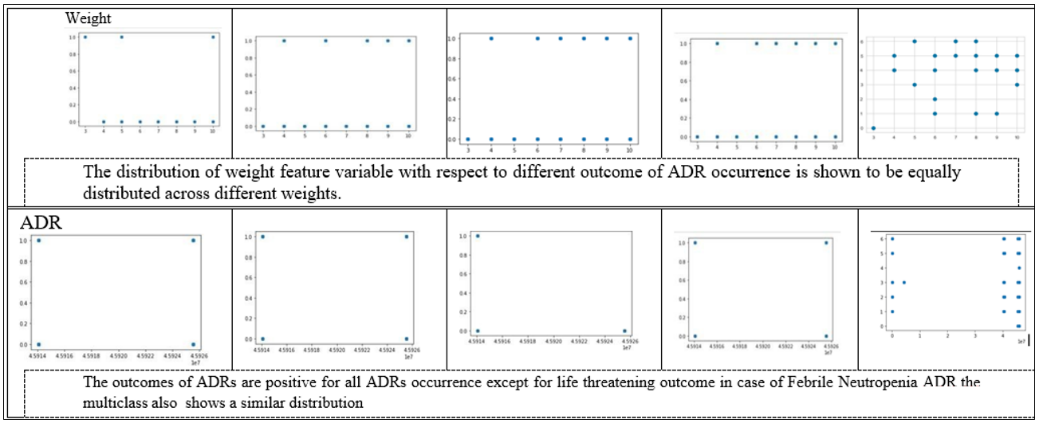
Bivariate analysis
Scatter plots are used to visualize the distribution of feature variables concerning the target. They are applied to classify the outcome of adverse reactions. The target outcomes for the other dataset are reflected in table 4.
DE:-Death due to the impact of an adverse drug reaction.
HO:-Hospitalization due to adverse drug reaction.
LT:-Life-threatening occurrence due to adverse drug reactions
OT: Other serious medical issues due to adverse drug reactions
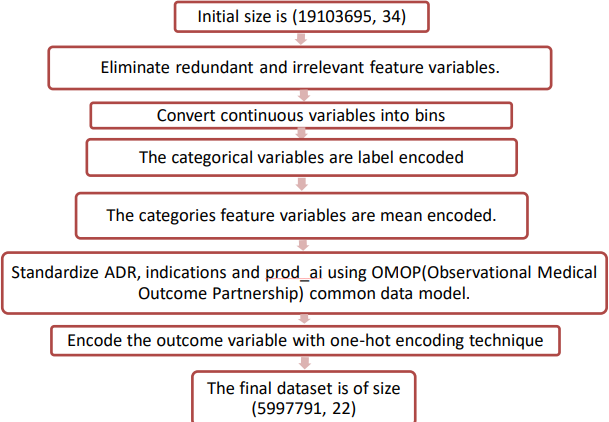
Fig. 6: Pre-processing step applied in the integrated dataset
Table 3: Univariate feature visualization
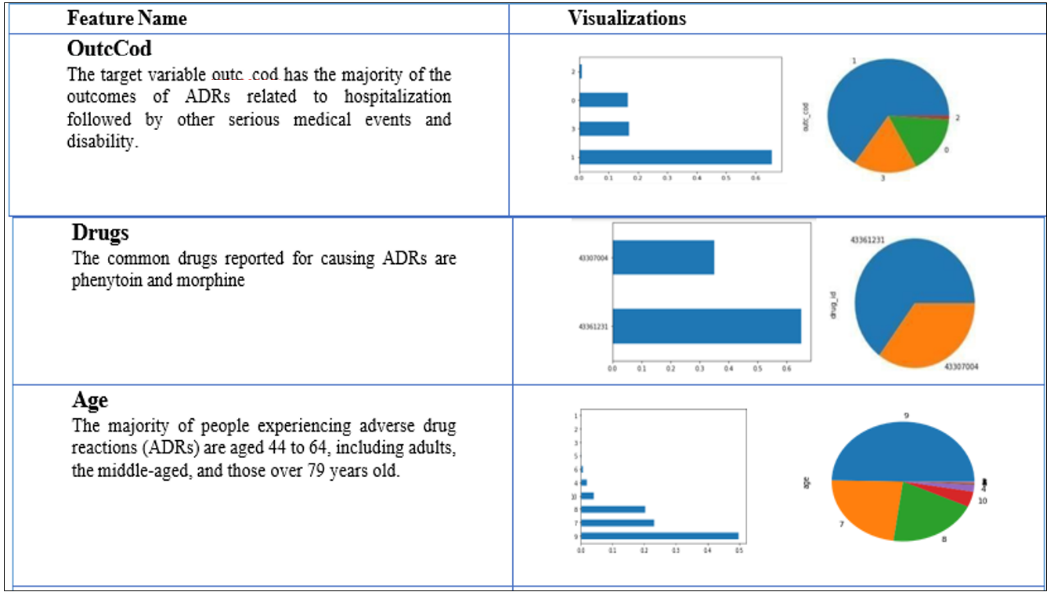
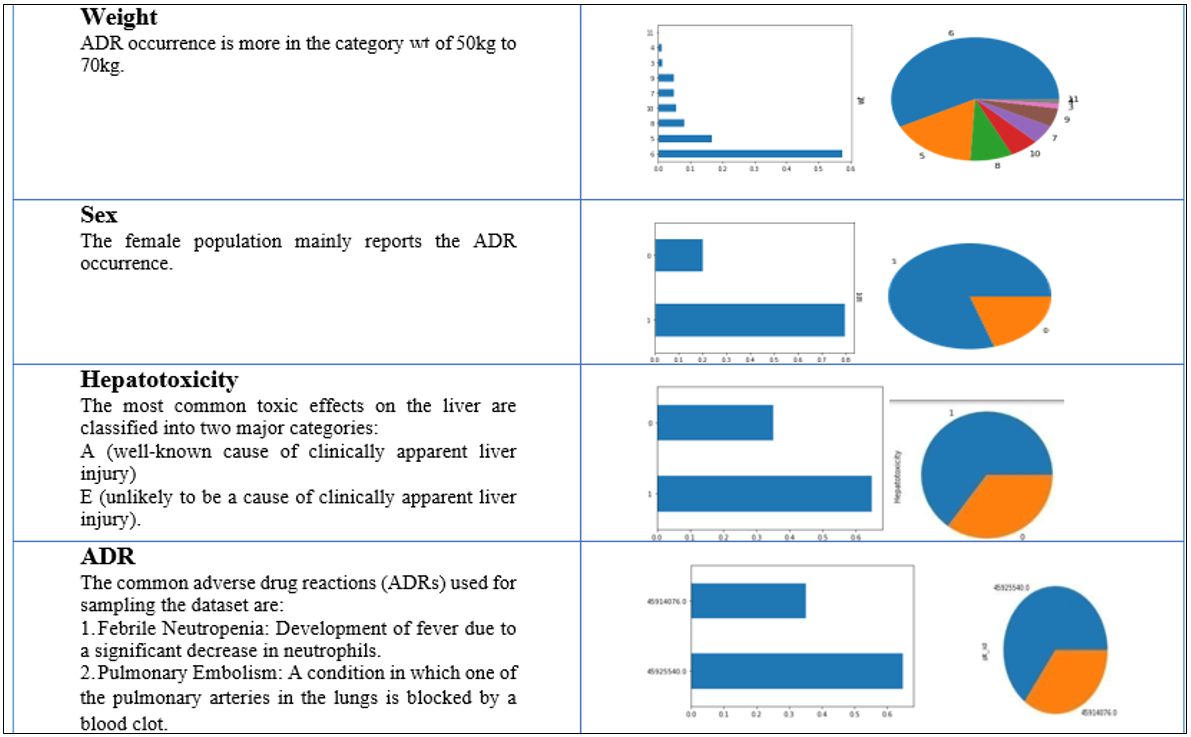
Table 4:-Bivariate analysis
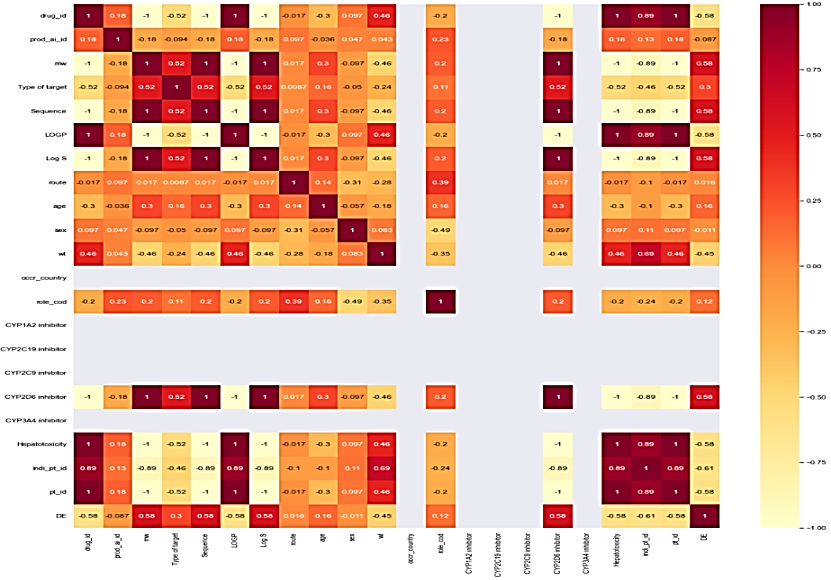
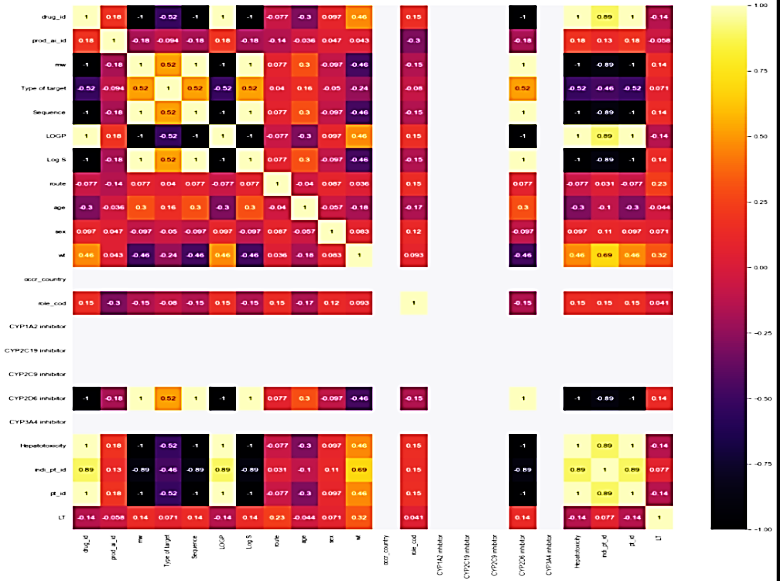
Correlation matrix
The correlation matrix demonstrates the relationship between feature variables. It can be direct, indirect, or neutral. Since four outcomes were identified, therefore correlation matrix was developed for all the outcomes, namely death, hospitalization, Life-threatening events, and other serious outcomes. Each correlation matrix is discussed in detail in the following fig. 7.
 |
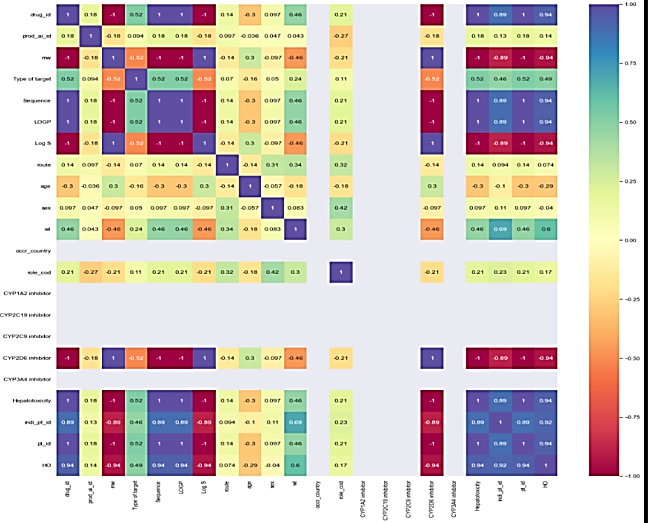 |
| Feature Variables v/s Death | Feature variables v/s hospitalization. |
| Some feature variables provide zero correlation to the target variable that needs to be eliminated in the further process. In the case of the death correlation matrix, the majority features have a strong positive or negative correlation concerning the target variable. Similarly, for hospitalization, the feature variable has a strong correlation a positive or negative with the outcome. | |
 |
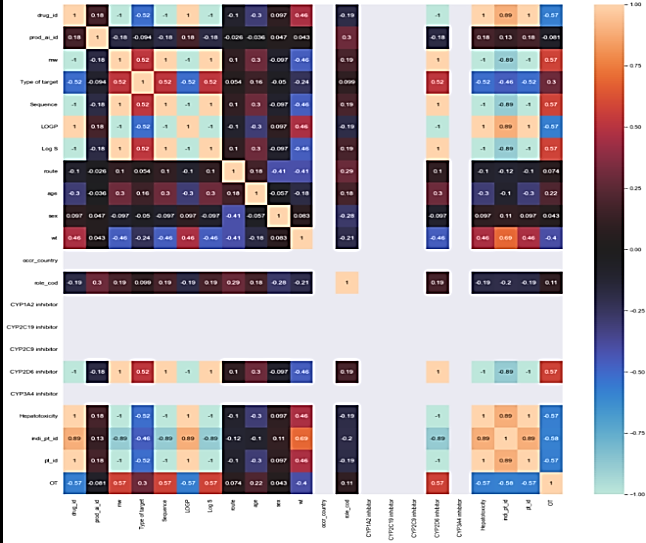 |
| Feature variables v/s life-threatening outcome | Feature selection v/s other serious medical issues |
| In life-threatening outcomes, the feature variables have a weak correlation to the target outcome while in the case of another serious medical issue, it is the averaged-out correlation to the target outcome. The same features that have no relation to the outcome variable are eliminated in the overall process |
Fig. 7: Correlation matrix concerning death, hospitalization, life-threatening, and other serious medical outcome
Multicollinearity
Analyzingthecorrelationmatrixthecollinearityamongfeaturevariablesisobservedbased on Pandas and NumPy packages [17-18]. A significant correlation was found between commercial drug names and product substances. The rationale for removing "drug name" instead of "prod_ai" includes:-
-High Variable Count: "drug name" has a higher variable count compared to "prod_ai," causing the Jupyter Notebook to crash multiple times.
-Relevance to ADRs: Side effects and adverse drug reactions (ADRs) are caused by the product substance rather than the commercial drug name.
Dataset normality test
This test helps to check the distribution of data in the given dataset. There are two test states used to check how the data is distributed. It is described in the following section.
QQPlots
QQplots [19] are used to determine the type of distribution for a random variable, such as Gaussian, Uniform, Exponential, or Pareto distributions. By analyzing the Q-Q plot, you can identify the distribution type simply by examining the plot's characteristics. The Q-Q plot based on the distribution of the X feature variables is shown in fig. 8. The distribution is not normal.

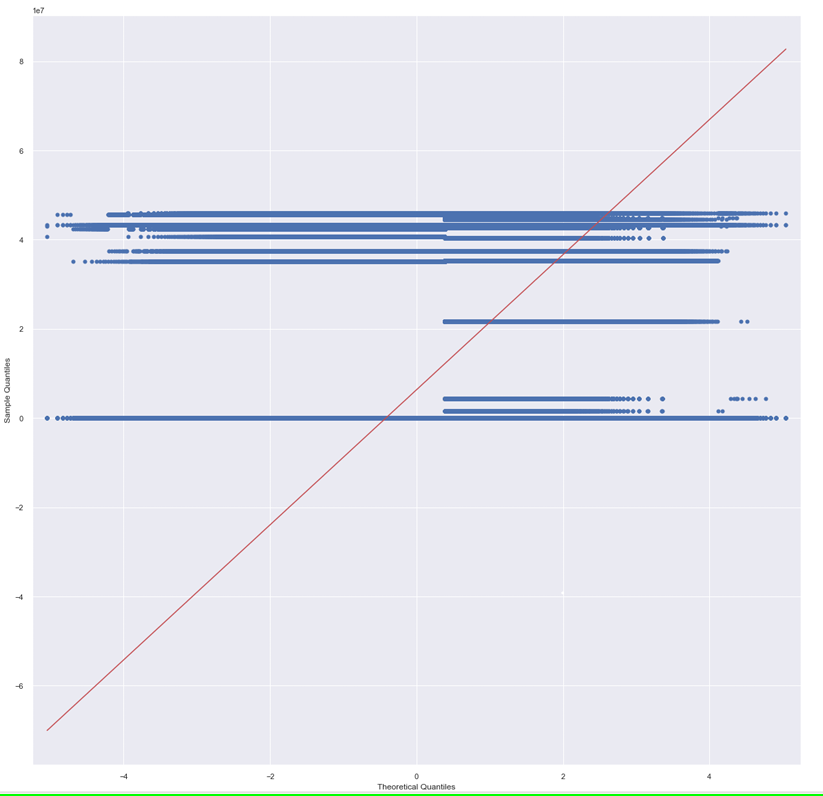
Fig. 8: QQ plots
Kruskal-wallis test
To determine the statistically significant difference between the medians of three or more independent groups, this test is performed. The output is shown below.
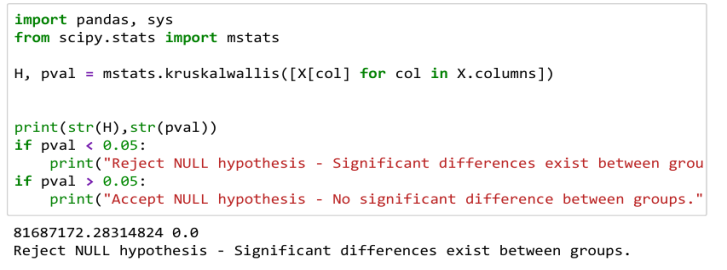
Since the value of p is less than 0.05, that signifies significant differences exist among groups and therefore the NULL hypothesis is rejected.
Feature scaling
The dataset has features with different ranges. In the binary classification model, if the features are not scaled, there is a possibility of bias towards feature variables with similar ranges as compared to those feature variables with different ranges. An overview of feature variables in the dataset with different ranges is shown in table 5.
The above diagram shows that the drug feature variable, as well as active product ingredients, have higher range values in comparison to other feature variables. Therefore, feature scaling is applied to scale the range of independent variables into some common boundaries [20]. Different techniques for scaling are discussed in fig. 9.
Table 5: Data frame showing different feature variables with different ranges
| Prod ai | mw | Target | Sequence | LOGP | $ | Route | Age | Sex | Role cod | Inhibitor | Inhibitor | Inhibitor | Inhibitor | Inhibitor | Hepatotoxicity |
| 3048773.0 | 252.27 | 0.01105 | 0.01105 | 2.26 | -3.55 | 0.0000 | 4 | 1 | 0.043222 | 0 | 0 | 0 | 0 | 0 | 0 |
| 3315416.0 | 252.27 | 0.01105 | 0.01105 | 2.26 | -3.55 | 0.1862 | 9 | 1 | 0.043222 | 0 | 0 | 0 | 0 | 0 | 0 |
| 3361669.0 | 252.27 | 0.01105 | 0.01105 | 2.26 | -3.55 | 0.1862 | 9 | 1 | 0.179673 | 0 | 0 | 0 | 0 | 0 | 0 |
| 3315416.0 | 252.27 | 0.01105 | 0.01105 | 2.26 | -3.55 | 0.1862 | 9 | 1 | 0.043222 | 0 | 0 | 0 | 0 | 0 | 0 |
| 3361669.0 | 252.27 | 0.01105 | 0.01105 | 2.26 | -3.55 | 0.1862 | 9 | 1 | 0.179673 | 0 | 0 | 0 | 0 | 0 | 0 |
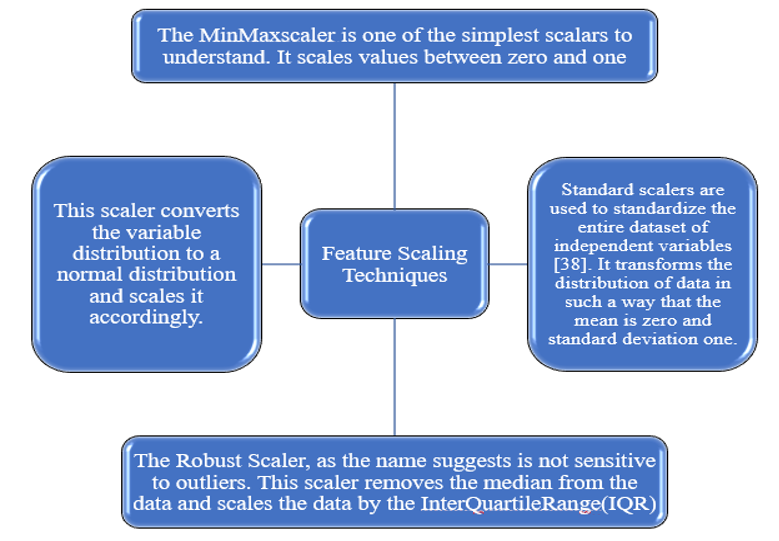
Fig. 9: Feature scaling types
After analyzing the results of four scaling techniques, it seems that the standard scalar provides maximum distribution of data on the line, but the precondition to apply the standard scaler on the given dataset is that the dataset should have a Gaussian distribution. In our case, our dataset does not have a Gaussian distribution we cannot apply a standard scaling technique to it. So, the best scaling technique that does not consider the distribution of the dataset is the Min-Max scaling technique. Therefore, on both datasets, we have proceeded with the application of the Min-max scaling technique and showed the results in the following diagram.
Table 6: Results derived after application of the Min-Max scaler technique
Feature selection
The current dataset includes several feature variables with a low variance that will not contribute much to the target outcome [21]. Eliminating such feature variables will improve the performance of the model. The techniques applied for feature selection can be broadly classified into three categories in fig. 10.
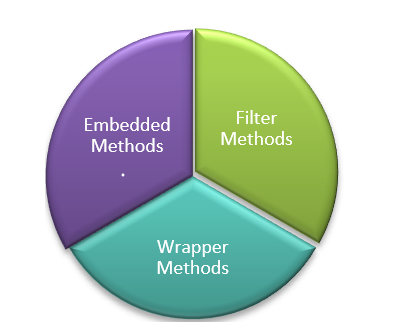
Fig. 10: Feature selection techniques
To identify the most significant features in the dataset, imgded methods are used, as they combine the advantages of both wrapper and filter methods. These methods consider feature interactions while keeping actions while keeping computational costs manageable [22]. The imgded method employed for feature selection is the Extremely Randomized Trees Classifier (Extra Trees Classifier) [23]. The Extra Trees Classifier is an ensemble learning technique that aggregates the results of multiple decor-related decision trees, collected in a "forest," to produce the classification result. The snippet code for the imgded feature selection is shown in the following section below.
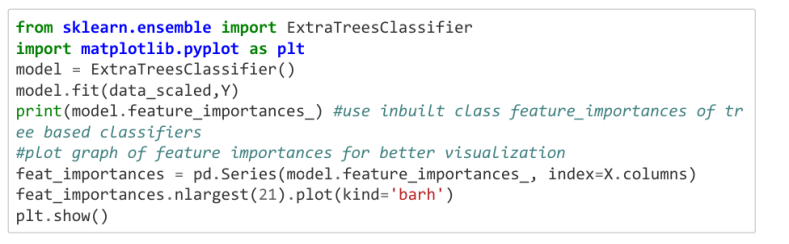
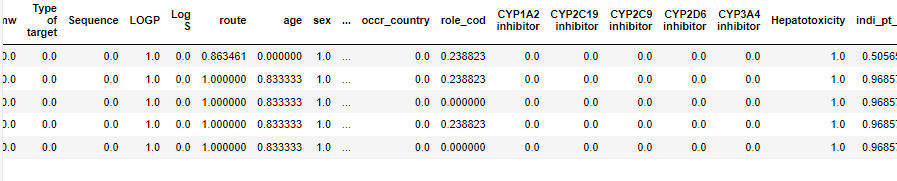
For different target outcomes, the results are shown in fig. 1
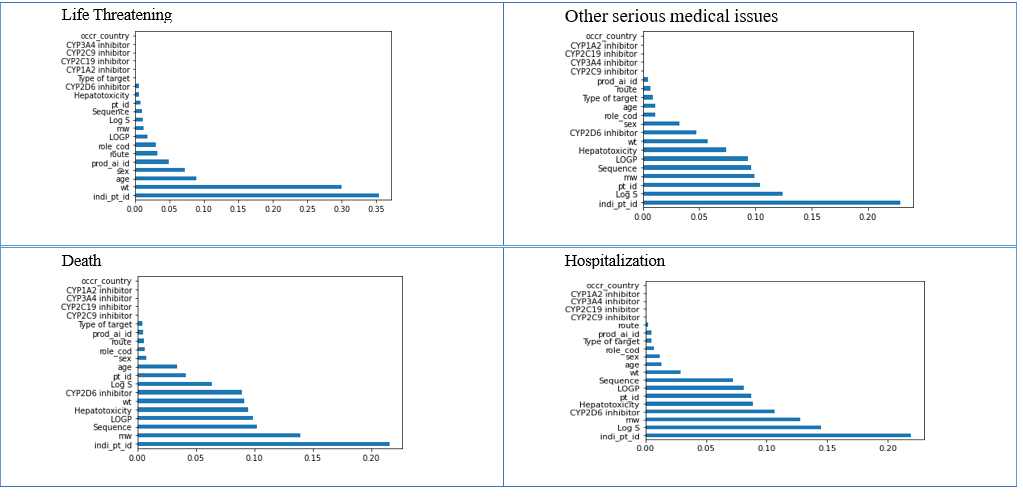
Fig. 11: Data frame of relevant features concerning different outcomes
After applying feature selection to the datasets, the features that were not contributing meaningfully to the outcome variable were eliminated, and only the filtered number of features were considered for further analysis. In only one feature selection concerning life-threatening outcomes, the feature variables have a low feature selection value as compared to other outcome datasets. Therefore, many features are eliminated in the given dataset for further processing.
RESULTS AND DISCUSSION
The successful integration of FAERS, SIDER, DrugBank, and PubChem databases yielded a comprehensive dataset containing standardized drug identifiers, adverse event profiles, and molecular descriptors. Data cleaning processes resolved nomenclature inconsistencies across 85% of entries, achieving 92% data completeness after systematic harmonization. The integrated dataset comprised over 15,000 unique drug entities with associated adverse event reports and molecular properties, providing unprecedented coverage for pharmacovigilance analysis. Advanced visualization techniques effectively revealed complex relationships within the integrated dataset. Network diagrams illustrated hub nodes representing highly connected drugs or frequently reported adverse events, facilitating identification of critical monitoring targets. Temporal trend analysis exposed seasonal variations in adverse event reporting for specific drug classes, suggesting usage pattern influences on safety outcomes.
The integration methodology provided comprehensive coverage superior to single-source analyses by combining FAERS real-world evidence with SIDER's systematic documentation and molecular information from DrugBank and PubChem. This approach successfully addressed data fragmentation issues common in pharmacovigilance research while maintaining data quality through rigorous standardization procedures. The resultant dataset enables more robust signal detection and supports evidence-based decision-making in drug safety assessment. The visualization framework enhances interpretability for researchers and regulatory professionals, facilitating rapid identification of safety concerns and supporting proactive pharmacovigilance initiatives.
Limitation of the study
The FAERS dataset was collected during the 2019-20 period, and the same tables are being used for integration both within that timeframe and in the post-COVID era. Since the integration technique remains unchanged, there is a possibility of temporal bias influencing the dataset.
Understanding temporal bias
Mitigating temporal bias
One effective way to reduce this bias is by broadening the dataset to include additional data points spanning later periods. Incorporating post-2020 information would enhance the dataset’s ability to capture shifts in adverse event patterns, ensuring a more comprehensive and accurate representation of trends both before and after the pandemic. By expanding the dataset, researchers can improve analytical accuracy and minimize distortions caused by outdated reporting practices.
CONCLUSION
In conclusion, this study successfully undertook the pre-processing of an integrated dataset derived from four major repositories: FAERS, SIDER, DrugBank, and PubChem. The integration process involved meticulous data cleaning and normalization to ensure the coherence of information across diverse sources. The standardized dataset was then subjected to exploratory data analysis, revealing intricate relationships and patterns within drug-related information. The utilization of advanced visualization techniques further enhanced the interpretability of the integrated dataset. Visual representations facilitated the identification of significant trends, associations, and potential correlations, offering a comprehensive view of drug interactions, adverse events, and molecular properties. Researchers and practitioners in pharmacovigilance and drug discovery can leverage these visualizations to make informed decisions and gain deeper insights into the complexities of drug-related data. The success of this pre-processing and visualization approach underscores the importance of integrating diverse datasets for a holistic understanding of drug-related information. The resultant dataset, now refined and accessible, stands as a valuable resource for researchers and decision-makers in the continual pursuit of safer and more effective pharmaceutical interventions.
FUNDING
Nil
AUTHORS CONTRIBUTIONS
Dr. Shiksha Dubey has been mainly involved in the conceptualization and implementation of this concept of research. As far as the second author is concerned, only the guidance part is provided for the research article.
CONFLICT OF INTERESTS
Declared none
REFERENCES
Ventola CL. Big data and pharmacovigilance: data mining for adverse drug events and interactions. PT. 2018 Jun;43(6):340-51. PMID 29896033.
The ICH Expert Working Group. Post-approval safety data management: definitions and standards for expedited reporting. ICH Harmonised Tripartite; 2003 Nov. Available from: http://www.fda.gov/cber/gdlns/ichexrep.htm.
Dubey SA, Kharkar P, Pandit AA. Neural network-based adverse drug reaction prediction using molecular substructure analyses; 2023. http://dx.doi.org/10.2139/ssrn.4507918.
Panigrahy A, Begum A, Pingali U, Padmaja M, Sajeev A. Evaluation of cutaneous adverse drug reactions in a Tertiary Care Hospital in Southern India: a retrospective analysis. Asian J Pharm Clin Res. 2024;17(11):143-7. doi: 10.22159/ajpcr.2024v17i11.52291.
Kaur T, Margam N, Randhawa GK. Current trends of cutaneous adverse drug reactions in a Tertiary Care Hospital in North India: a retrospective study. Asian J Pharm Clin Res. 2024 Aug;17(8):142-6. doi: 10.22159/ajpcr.2024v17i8.51076.
Alomar MJ. Factors affecting the development of adverse drug reactions. Saudi Pharm J. 2014 Mar;22(2):83-94. doi: 10.1016/j.jsps.2013.02.003, PMID 24648818.
Amale PN, Sa D, Yd N, Na A. Pharmacovigilance process in India: an overview. J Pharmacovigil. 2018;6(2):259. doi: 10.4172/2329-6887.1000259.
The thalidomide tragedy: lessons for drug safety and regulation. Available from: https://helix.Northwestern.Edu/Article/Thalidomide-Tragedy-Lessons-Drug-Safety-and-Regulation. [Last accessed on 05 Jul 2025].
Friedrich F. Automated generation of business process models from natural language input [Master’s thesis]. Berlin (DE): Humboldt-Universität zu Berlin; 2010.
Létinier L, Jouganous J, Benkebil M, Bel Letoile A, Goehrs C, Singier A. Artificial intelligence for unstructured healthcare data: application to coding of patient reporting of adverse drug reactions. Clin Pharmacol Ther. 2021 Aug;110(2):392-400. doi: 10.1002/cpt.2266, PMID 33866552.
Dal Pan GJ, Arlett PR. The US food and drug administration-european medicines agency collaboration in pharmacovigilance: common objectives and common challenges. Drug Saf. 2015;38(1):13-5. doi: 10.1007/s40264-014-0259-3, PMID 25539878.
Kuhn M, Letunic I, Jensen LJ, Bork P. The SIDER database of drugs and side effects. Nucleic Acids Res. 2016 Jan;44(D1):D1075-9. doi: 10.1093/nar/gkv1075, PMID 26481350.
Pandit AA, Dubey SA. A comprehensive review on adverse drug reactions (ADRs) detection and prediction models. In: 13th International Conference on Computational Intelligence and Communication Networks (CICN); 2021. p. 123-7. doi: 10.1109/CICN51697.2021.9574639.
Wishart DS, Knox C, Guo AC, Cheng D, Shrivastava S, Tzur D. DrugBank: a knowledgebase for drugs, drug actions and drug targets. Nucleic Acids Res. 2008 Jan;36:D901-6. doi: 10.1093/nar/gkm958, PMID 18048412.
Wang Y, Xiao J, Suzek TO, Zhang J, Wang J, Bryant SH. PubChem: a public information system for analyzing bioactivities of small molecules. Nucleic Acids Res. 2009 Jul;37 Suppl 2:W623-33. doi: 10.1093/nar/gkp456, PMID 19498078.
Van Bruggen R, Learning N4j. Birmingham, UK: Packt Publishing Ltd.; 2014.
Rodriguez P, Bautista MA, Gonzalez J, Escalera S. Beyond one-hot encoding: lower dimensional target imgding. Image Vis Comput. 2018;75(5). doi: 10.1016/j.imavis.2018.04.004.
Alin A. Multicollinearity. WIREs Computational Stats. 2010;2(3):370-4. doi: 10.1002/wics.84.
Das B, Resnick SI. QQ plots, random sets and data from a heavy tailed distribution. Stoch Models. 2008;24(1):103-32. doi: 10.1080/15326340701828308.
Bisong E. Introduction to Scikit-learn. In: Building machine learning and deep learning models on Google Cloud Platform. Berkeley, CA: Apress; 2019. p. 215-29. doi: 10.1007/978-1-4842-4470-8_18.
Kumar V. Feature selection: a literature review. Smart CR. 2014;4(3):211-29. doi: 10.6029/smartcr.2014.03.007.
Lal TN, Chapelle O, Weston J, Elisseeff A. imgded methods. In: Guyon I, Nikravesh M, Gunn S, Zadeh LA, editors. Feature extraction. Berlin: Springer; 2006. p. 137-65. doi: 10.1007/978-3-540-35488-8_6.
Sharaff A, Gupta H. Extra-tree classifier with metaheuristics approach for email classification. In: Bhatia SK, Tiwari S, Mishra KK, Trivedi MC, editors. Advances in computer communication and computational sciences. Singapore: Springer; 2019. p. 189-97. doi: 10.1007/978-981-13-6861-5_17.