
Int J Pharm Pharm Sci, Vol 17, Issue 12, 7-12Original Article
ANALYTICAL METHOD DEVELOPMENT AND VALIDATION OF FENOFIBRATE IN BULK AND FORMULATIONS VIA UV SPECTROPHOTOMETRY
GITA CHAURASIA*, AJANTA TOTRE, SWATI DESHMUKH
Department of Pharmaceutics, Siddhant College of Pharmacy, Sudumbare-412109, Pune, Maharashtra, India
*Corresponding author: Gita Chaurasia; *Email: ajt27590@gmail.com
Received: 05 Aug 2025, Revised and Accepted: 05 Oct 2025
ABSTRACT
Objective: The aim of the present work was developing the Ultra-violate (UV) spectroscopic analytical method for analysis of Fenofibrate in bulk and formulations. The drug is used for the treatment of primarily hypercholesterolemia and mixed dyslipidemia.
Methods: The precise, convenient, simple, sensible and reproducible UV methods were developed, in solvents includes Methanol pure (A), Pure Polyethylene glycol (PEG)-400 (B), Ethanol: Propylene glycol (1:9) solution (EPG)-(C). Each were scanned in range of200-400 nm at concentration of 10µg/ml. The linearity with high sensitivity was obtained in UV spectrum, in therangefrom5-55μg/ml in solvents A, B and C, via Double beam UV-Visible Spectrophotometer. Validation was done as per ICH Q2B guideline parameters (Range, Linearity, Robustness, Precision, Ruggedness, Accuracy, Limit of detection (LOD) and Limit of quantification (LOQ), by using predefined calibration standards for the developed methods. Marketed formulation Lipicard-160 tablets I. P. was used for method validation in each solvent A, B and C.
Results: The absorption maxima was observed in the solvents A, Band C, at 287.0 nm; 288.0 nm and286.0 nm, and the percentage average drug recovery was found to be 99.87; 99.74 and 98.76 respectively (n=6).
Conclusion: The proposed method was successfully developed in chosen solvents and validated for the determination of Fenofibrate in bulk and formulations as per ICH Q2B parameters.
Keywords: Fenofibrate, Estimation of fenofibrate, UV methods, Fenofibrate analysis, Anti-hyperlipidaemic drug, Lipoprotein lipase activators
© 2025 The Authors. Published by Innovare Academic Sciences Pvt Ltd. This is an open access article under the CC BY license (https://creativecommons.org/licenses/by/4.0/)
DOI: https://dx.doi.org/10.22159/ijpps.2025v17i12.56405 Journal homepage: https://innovareacademics.in/journals/index.php/ijpps
INTRODUCTION
Fenofibrate, is an Anti-hyperlipidaemic drug, used in the treatment of primarily hypercholesterolemia and mixed dyslipidaemia. It falls under BCS class-II drug, having IUPAC name-Propane-2-yl-2-{4-[4-chlorophenyl)-carbonyl] phenoxy}-2-methyl propanoate. It is of Molecular formula, C20H21ClO4 and molecular weight, 360.83 g/mol. It is considered as derivative of fibrate that lowers lipid levels by activation of peroxisome proliferator-activated receptor alpha, a lipoprotein lipase activator and reduces apoprotein CIII, which enhances lipolysis process and eliminates triglyceride-rich particles from plasma [1]. Literature revealed that various chromatographic/analytical methods has been developed for quantitative determination of Fenofibrate analysis, which includes high-performance liquid chromatography/Reverse Phase liquid chromatography [2, 3], high-performance thin-layer chromatography [4], UV/vis-spectrophotometry [5-8], Fourier transform infrared spectroscopy [9], Densitometric TLC analysis [10], differential scanning calorimetry [11], capillary electrophoresis method [12], NMR method [13, 14] and X-ray powder diffraction analysis [15] etc. Literature reveals that these methods often involve complexity in preparing the sample and time-taking in running the procedure. Also, involves the costly instrumentation that limits its applicability and sometimes availability. To overcome all these barriers UV spectroscopy methods, have easy to use, cost effective sample preparation and instrumentation. Thus, the present study was aimed to produce simple, precise, economic, reproducible UV methods for estimation of Fenofibrate in bulk and pharmaceutical dosage form.
MATERIALS AND METHODS
Materials
Fenofibrate, was generous gift sample from Zuventus Healthcare Ltd, Pune, India. Methanol, PEG-400, Propylene glycol and Ethanol from Lab India, were received. Commercial Fenofibrate tablet I. P. (160 mg) was purchased from local pharmacy store. Analytical grade chemicals were provided by Research-Lab Fine Chem Mumbai, and Freshly prepared distilled water is used throughout the work.
Methods
The UV spectrophotometric method was adopted in the present work for estimation and validation of Fenofibrate using different solvents or cosolvents in bulk and marketed formulations (tablets).
Preparation of experimental solvents
Solvent A: The required amount of pure analytical grade Methanol was taken in a dry volumetric flask for method development.
Solvent B: The required amount of pure PEG-400, was taken in a dry volumetric flask for the present work.
Solvent C (EPG): Ethanol and propylene glycol, was mixed in 1:9 ratio, in a volumetric flask respectively. Sonicated for 10 min to avoid any air entrapment for the study.
Preparation of standard stock solution
Accurately weighed 10.0 mg of Fenofibrate in triplicate and dissolved in 100 ml of solvent A, B, and C, separately by adding slowly in 100 ml of amber colored volumetric flask and was sonicated until drug was dissolved, to produce 100µg/ml stock solution. 10µg/ml concentration was prepared by diluting 1.0 ml of this solution with respective solvent to 10.0 ml. These samples were scanned by UV spectrophotometric method in a range of 200-400 nm by Double beam UV-Visible Spectrophotometer Jasco-V630, Japan (n=6) and recorded.
Preparation of standard curve
The stock solution (100µg/ml) of each solvent was used to make dilutions of 1.0, 2.0, 3.0, 4.0, 5.0 and 5.5 ml via graduated pipette and transferred it into a series of 10 ml amber colored volumetric flasks. These were diluted suitably up to 10 ml with respective solvents to produce10-55µg/ml concentration. The absorbance of each solution was observed under UV-visible spectrophotometric method by taking each solvent as a blank solution individually. Reported data were processed for standard curve construction and the linearity was established (n=6) Microsoft office Excel software was used for validation of collected data for various statistical parameters.
Validation of method development
ICH Q2B guidelines were followed for the validation of developed UV methods using solvent A, B, and C. Predefined calibration standards were used to validate for the parameters like linearity and range, precision, accuracy, robustness, ruggedness, LOD and LOQ as mentioned below [16].
Linearity and range
This was established in the standard curve, when plotted against absorbance vs concentrationby the linear least square regression analysis method. Correlation coefficients (r2) and linear equation was established for all samples.
Precision (Repeatability)
Inter day and intraday precision was determined for three times on the same day and on three different days by measurement of the absorbance. The relative standard deviation (RSD) for replicates of sample solutions should be less than 2% to meet the acceptance criteria for established methods [17].
Accuracy (Recovery study)
Standard addition method was adopted for this study for all samples. It was carried outin three different solutions of drug at known concentration of 10, 20 and 30 mg in triplicate and accuracy was determined based on percent recovery (PC). It was calculated as- Where, SPS = Amount of drug found in the spiked sample
SP = Amount of drug added to the sample
S = Amount of drug found in the sample
Robustness
It was calculated by changing the ratio of each solvents A, B, and C as a co-solvent system by changing1:9 to 3:9. Fenofibratein40 µg/ml concentration for each solvent was prepared by sonication for 10 min. (n=6) and sample was analysed at a changed wavelength of 285 nm for each solvent. The result was calculated in terms of %RSD.

Ruggedness
Two different analysts I and II via two distinct instruments (V-730, Jasco and V-630, Jasco Japan) through UV/VIS method (n=6), at drug sample 40µg/ml eachwas analysed. Result was computed in terms of % RSD.
Determination of LOQ and LOD
These were determined using the following formula [18], 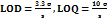
Where ‘σ’ is the standard deviation (SD) of the response and s is the slope of the calibration curve (n=6).
Determination of average % drug recovery in marketed formulation
Ten Fenofibrate tablet I. P. (Lipicard-160 mg) were weighed, crushed, powdered and sieved. Amount equivalent to 100.0 mg was weighed (n=6) and dissolved in solvent A, B and C separately by sonication method. Dilutions were made to produce10µg/ml concentration. These samples were analyzed through UV-method by taking each solvent as blank. The drug content was calculated by difference of initial concentration to final concentration in percentage (n=6) and average % drug recovery was calculated as per the labelled amount on tablet.
RESULTS AND DISCUSSION
Fenofibrate solution (10µg/ml) was carried out for scanning in UV range in each solvent A, B and C. The absorption spectra were reported as 287 nm; 288 nm and 286 nm respectively (fig. 1, 2, 3). Aunde et al. [19], reported the UV method for simultaneous estimation of rosuvastatin calcium and fenofibrate in methanol at λ max of 287 nm. The aliquots of concentration range 10-55µg/ml were analyzed and Calibration curves for each solvent were prepared as shown in fig. 4. All data were computed for different parameter via Microsoft office Excel as per ICH guideline for suitability of developed method and reported in table 1.
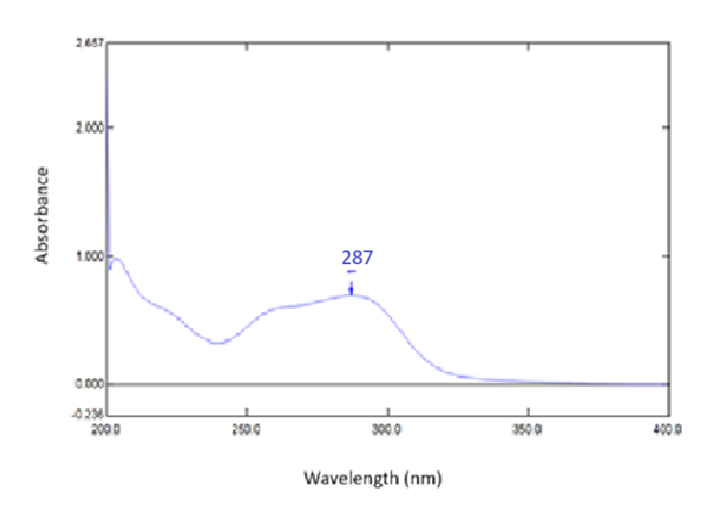
Fig. 1: UV-visible spectrum of fenofibrate in solvent A (n=6)
Table 1: Optical characteristics of proposed method in different solvents*
| S. No. | Parameter | Solvent A | Solvent B | Solvent C |
| 1 | Absorbance maximum (λmax) in nm | 287.0 | 288.0 | 286.0 |
| 2 | Beer-Lambert’s Law Limit (µg/ml) | 10-55 | 10-55 | 10-55 |
| 3 | Regression equation | Y=0.187x+0.014 | Y=0.0123x+0.0023 | Y= 0.0119x-0.007 |
Slope Intercept |
0.187 0.014 |
0.0123 0.0023 |
0.0119 -0.007 |
|
| 4 | Regression coefficient | 0.9996 | 0.9998 | 0.9987 |
| 5 | RSD (n=9) | ±0.0096 | ±0.0098 | ±0.0091 |
| 6 | Standard error | 3.45 x10⁻⁷ | 2.94 x10⁻⁷ | 2.88 x10⁻⁷ |
| 7 | % error in bulk sample (n=9) | 2.63x10⁻⁶ | 2.79x10⁻⁶ | 2.21x10⁻⁶ |
| 8 | LOD (µg/ml) | 0.1612±0.52 | 0.1725±0.16 | 0.1591±0.44 |
| 9 | LOQ (µg/ml) | 0.211±0.47 | 0.2251±0.28 | 0.1942±0.19 |
All data were computed statistically Mean±SD, (n=6).
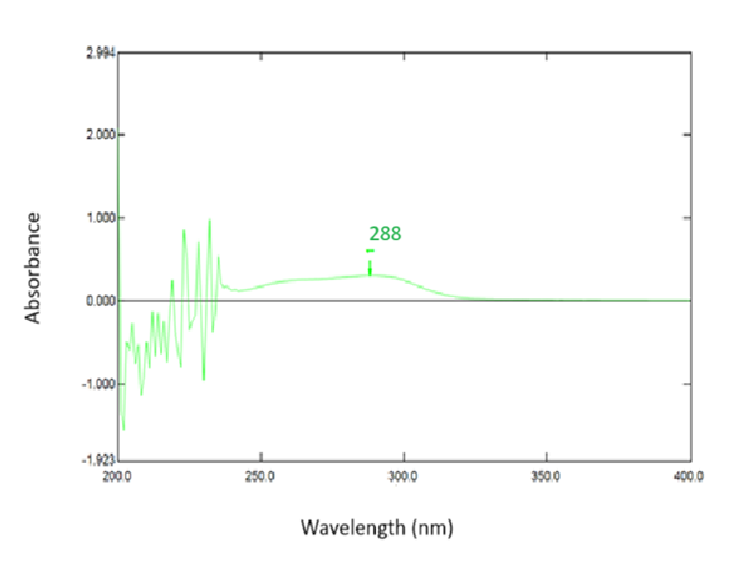
Fig. 2: UV-visible spectrum of fenofibrate in solvent B (n=6)
Fig. 3: UV-visible spectrum of fenofibrate in solvent C (n=6)
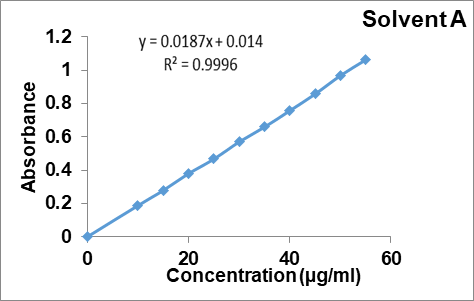
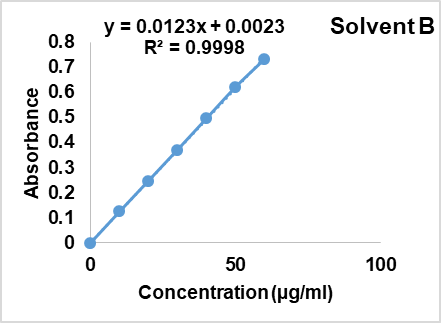
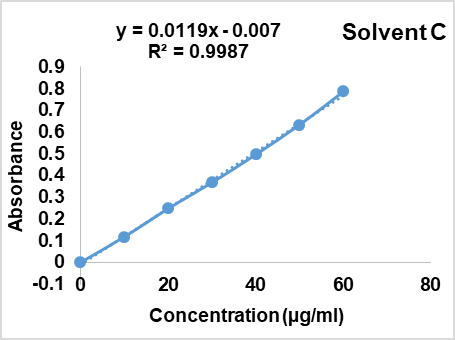
Fig. 4: Calibration curve of fenofibrate in solvent A, B and C, mean±Absorbance, (n=6)
It involved Intraday (same day) and Inter day precious study (at three days) in 10µg/ml; 20µg/ml and 30µg/ml concentration for all solvents under study. Statistical parameters like mean absorbance, concentration of drug, SD and % relative standard deviation (RSD) was studied as shown in table 2-7. A good precision was observed by developing an analytical method for all samples. It was observed that some of the absorbance values were closer to the other values for different concentrations (10-30µg/ml). Also, found with the % RSD values for this concentration. It was because of no significant changes observed in Inter-day and Intraday precision study.
Table 2: Intraday precision study in solvent A*
| Time | Mean absorbance of conc. (10 μg/ml) | Conc. Found (μg/ml) |
SD | % RSD |
Mean Absorbance of conc. (20 μg/ml) |
Conc. Found (μg/ml) |
SD | % RSD |
Mean absorbance of conc. (30μg/ml) |
Conc. found (μg/ml) | SD | % RSD |
| 11am | 0.1871±0.14 | 10.05±0.16 | 0.0079 | 0.62 | 0.3770±0.02 | 20.28±0.35 | 0.0112 | 1.16 | 0.5341±0.49 | 30.17±0.18 | 0.0343 | 0.92 |
| 2pm | 0.1885±0.87 | 10.16±0.81 | 0.0131 | 0.87 | 0.3811±0.51 | 20.31±0.96 | 0.0141 | 1.20 | 0.5720±0.65 | 30.23±0.26 | 0.0411 | 0.95 |
| 5pm | 0.1893±0.92 | 10.28±0.46 | 0.0185 | 1.28 | 0.3843±0.30 | 20.36±0.57 | 0.0218 | 1.36 | 0.5540±0.37 | 30.28±0.55 | 0.0482 | 1.03 |
All data were computed statistically mean±SD, (n=6).
Table 3: Intraday precision study in solvent B*
| Time | Mean absorbance of conc. (10 μg/ml) |
Conc. found (μg/ml) |
SD | % RSD |
Mean Absorbance of conc. (20 μg/ml) |
Conc. found (μg/ml) |
SD | % RSD |
Mean absorbance of conc. (30 μg/ml) |
Conc. found (μg/ml) | SD | % RSD |
| 11am | 0.1934±0.13 | 10.14±0.69 | 0.0081 | 0.63 | 0.3412±0.27 | 20.11±0.20 | 0.0074 | 0.93 | 0.5172±0.06 | 30.12±0.38 | 0.0172 | 1.27 |
| 2pm | 0.1943±0.47 | 10.26±0.08 | 0.0117 | 0.81 | 0.4113±0.93 | 20.36±0.26 | 0.0128 | 1.15 | 0.5251±0.58 | 30.31±0.41 | 0.0183 | 01.32 |
| 5pm | 0.1948±0.53 | 10.34±0.22 | 0.0156 | 1.07 | 0.4412±0.72 | 20.42±0.55 | 0.0151 | 1.19 | 0.5477±0.35 | 30.56±0.67 | 0.0241 | 1.44 |
All data were computed statistically mean±SD,(n=6).
Table 4: Intraday precision study in solvent C*
| Time | Mean absorbance of conc. (10 μg/ml) |
Conc. found (μg/ml) |
SD | % RSD |
Mean absorbance of conc. (20 μg/ml) |
Conc. found (μg/ml) |
SD | % RSD |
Mean absorbance of Conc. (30 μg/ml) |
Conc. found (μg/ml) | SD | % RSD |
| 11am | 0.1911±0.91 | 10.17±0.03 | 0.0087 | 0.71 | 0.3740±0.61 | 20.20±0.51 | 0.0082 | 0.97 | 0.5240±0.78 | 30.16±0.29 | 0.0083 | 0.86 |
| 2pm | 0.1931±0.40 | 10.25±0.48 | 0.0092 | 1.04 | 0.3761±0.33 | 20.25±0.88 | 0.0173 | 1.09 | 0.5572±0.19 | 30.34±0.41 | 0.0091 | 1.05 |
| 5pm | 0.2011±0.66 | 10.32±0.71 | 0.0134 | 1.06 | 0.3782±0.95 | 20.28±0.12 | 0.0192 | 1.33 | 0.5641±0.52 | 30.61±0.64 | 0.0114 | 1.21 |
All data were computed statistically mean±SD, (n=6).
Table 5: Interday precision study in solvent A*
| Days | Mean absorbance of conc. (10 μg/ml) |
Conc. found (μg/ml) |
SD | % RSD |
Mean absorbance of conc. (20 μg/ml) |
Conc. found (μg/ml) |
SD | % RSD |
Mean absorbance of conc. (30 μg/ml) |
Conc. found (μg/ml) | SD | % RSD |
| 1 | 0.1914±0.09 | 10.15±0.26 | 0.0021 | 0.64 | 0.3620±0.63 | 20.15±0.44 | 0.0067 | 0.81 | 0.5420±0.11 | 30.18±0.99 | 0.0115 | 0.82 |
| 2 | 0.1924±0.83 | 10.22±0.57 | 0.0036 | 1.08 | 0.3770±0.88 | 20.26±0.62 | 0.0131 | 0.98 | 0.5580±0.45 | 30.33±0.50 | 0.0132 | 0.88 |
| 3 | 0.1929±0.15 | 10.25±0.66 | 0.0097 | 1.12 | 0.3810±0.39 | 20.37±0.73 | 0.0251 | 1.18 | 0.5890±0.69 | 30.44±0.27 | 0.0143 | 1.23 |
All data were computed statistically mean±SD, (n=6).
Table 6: Inter day precision study in solvent B*
| Days | Mean absorbance of conc. (10 μg/ml) |
Conc. found (μg/ml) |
SD | % RSD |
Mean absorbance of conc. (20 μg/ml) |
Conc. found (μg/ml) |
SD | % RSD |
Mean absorbance of conc. (30 μg/ml) |
Conc. found (μg/ml) | SD | % RSD |
| 1 | 0.1912±0.05 | 10.02±0.33 | 0.0110 | 0.65 | 0.4120±0.81 | 20.21±0.47 | 0.0113 | 1.02 | 0.6216±0.30 | 30.30±0.87 | 0.0134 | 0.84 |
| 2 | 0.1928±0.94 | 10.24±0.75 | 0.0173 | 1.04 | 0.4310±0.17 | 20.22±0.63 | 0.0125 | 1.13 | 0.6324±0.49 | 30.38±0.70 | 0.0141 | 1.10 |
| 3 | 0.1942±0.42 | 10.33±0.54 | 0.0182 | 1.11 | 0.4440±0.06 | 20.39±0.19 | 0.0294 | 1.14 | 0.6510±0.36 | 30.42±0.55 | 0.0224 | 1.26 |
All data were computed statistically mean±SD,(n=6).
Table 7: Inter day precision study in solvent C*
| Days | Mean absorbance of conc. (10 μg/ml) |
Conc. found (μg/ml) |
SD | % RSD |
Mean absorbance of Conc. (20 μg/ml) |
Conc. found (μg/ml) |
SD | % RSD |
Mean absorbance of conc. (30 μg/ml) |
Conc. found (μg/ml) | SD | % RSD |
| 1 | 0.1921±0.02 | 10.20±0.07 | 0.0193 | 0.60 | 0.3112±0.21 | 20.18±0.47 | 0.0270 | 1.25 | 0.6018±0.64 | 30.10±0.92 | 0.0418 | 1.31 |
| 2 | 0.2118±0.11 | 10.23±0.13 | 0.0154 | 1.22 | 0.3420±0.62 | 20.34±0.16 | 0.0293 | 1.35 | 0.6241±0.32 | 30.24±0.08 | 0.0532 | 1.37 |
| 3 | 0.2216±0.62 | 10.27±0.71 | 0.0251 | 1.24 | 0.3540±0.51 | 20.55±0.73 | 0.0310 | 1.38 | 0.6312±0.22 | 30.46±0.36 | 0.0613 | 1.51 |
All data were computed statistically mean±SD, (n=6)
Studies were carried out by adding known amount of standard drug 10, 20and 30 mg in bulk. The good percentage recovery with % RSD was found for above drug concentrations as 98.87% recovery and 0.604 % RSD (10 mg), 98.17% recovery and1.04 % RSD (20 mg), and 99.34%recoveryand 0.971 % RSD (30 mg), respectively. From the recovery study it was observed that any small change in the concentration of Fenofibrate in solution can be detected accurately through this method.
Robustness or ruggedness of an analytical method is the ability to remain unaffected in its performance in spite of small, deliberate change in method parameters. It is expected that such change should not alter the performance of the method during routine use. Therefore, it was established for UV analysis by modifying the composition of the co-solvent system. Change in EPG solution ratio of 1:9 and 3:9 and small variation in wavelengths at 285 nm and 286 nm were studied for method validation. It was observed that small change in the solvent ratio and wavelength did not significantly affect the method performance and method is found rugged, reported by Kutty SV et al. [20] as shown in table 8The % RSD value less than 2 was proposed for robustness in the method. Ruggedness of method was validated by changing the instrument and analyst for %RSD analysis (table 9). The observed values showed the stability and suitability towards observed parameters.
Table 8: Robustness study of developed UV method
| Parameter | Absorbance* | %RSD (n=6) | |
| Solvent | EPG(1:9) | 0.7541± 0.18 | 1.21 |
| EPG (3:9) | 0.7419± 0.36 | 1.07 | |
| Observed wavelength (±1 nm) at | 285 nm | 0.7224± 0.62 | 1.33 |
| 286 nm | 0.7314± 0.14 | 1.24 |
*Drug concentration for analysis was 40µg/ml, mean±SD, (n=6)
Table 9: Ruggedness study of developed UV method
| S. No. | Parameter | %RSD (n=6) |
| 1 | Analyst I | 1.28 |
| 2 | Analyst II | 0.84 |
| 3 | V-730, Jasco UV/VIS Spectrophotometer | 1.09 |
| 4 | V-630, Jasco UV/VIS Spectrophotometer | 1.13 |
LOD is the lowest concentration at which detection of the analyte is feasible. LOQ is the lowest concentration at which an analyst is reliably detected with some predefined goals for imprecision and bias. It can be equivalent or may be higher in concentration. The developed UV methods showed LOD in solvents, A, B and C, 0.1612±0.52, 0.1725±0.16and 0.1591±0.44µg/ml respectively. The LOQ was observed in the same solvents were 0.211±0.47, 0.2251±0.28and 0.1942±0.19 µg/ml, respectively (n=6). Raosaheb GG et al. [21] reported that the lower values of LOD and LOQ indicate that method has good sensitivity. These methods were validated with marketed formulation Lipicard-160 mg. The percentage average recovery of drugs by the proposed method was found to be 99.87% (A-solvent), 99.74% (B-solvent) and 99.74% (C-solvent) and found no interaction with the excipients (n=6).
CONCLUSION
In conclusion, for quantitative analysis of Fenofibrate in solvents A, B and C, proposed UV methods were successfully developed and validated as per ICH guideline among different parameters. The developed methods were found to be simple, sensitive, precise, economical, reproducible and cost effective in routine analysis of drugs in bulk and formulations.
ACKNOWLEDGEMENT
The authors are thankful to Zuventus Healthcare Ltd, Pune, India and Principal, Siddhant college of Pharmacy, Pune for providing necessary facilities and constant support for research work.
FUNDING
Nil
AUTHORS CONTRIBUTIONS
Dr. Gita Chaurasia helped in Conceptualization, Investigation and Data handling to write the original draft. Ajanta Totre helped in editing and article writing and Dr. Swati Deshmukh worked on supervision in writing and data analysis. All authors contributed equally in preparing the research manuscript.
CONFLICT OF INTERESTS
The authors declared that there is no conflict of interest.
Bottom of Form
REFERENCES
Staels B, Dallongeville J, Auwerx J, Schoonjans K, Leitersdorf E, Fruchart JC. Mechanism of action of fibrates on lipid and lipoprotein metabolism. Circulation. 1998 Nov 10;98(19):2088-93. doi: 10.1161/01.CIR.98.19.2088, PMID 9808609.
Kumar SA, Debnath A, Rao JV, Sankar DG. Development and validation of a sensitive RP-HPLC method for simultaneous estimation of rosuvastatin and fenofibrate in tablet dosage form by using PDA detector in gradient mode. Res J Pharm Technol. 2016;9(5):549. doi: 10.5958/0974-360x.2016.00104.9.
Sukumar V, Chinnusamy S, Chanduluru HK, Rathinam S. Method development and validation of atorvastatin ezetimibe and fenofibrate using RP-HPLC along with their forced degradation studies and greenness profiling. Green Chem Lett Rev. 2023 Jan 2;16(1):2198651. doi: 10.1080/17518253.2023.2198651.
Kalyankar GG, Ghariya VV, Bodiwala KB, Lodha SR, Joshi SV. Development and validation of HPTLC method for simultaneous estimation of fenofibrate and rosuvastatin in tablet dosage form. J Pharm Appl Sci. 2016;3(1):1-7.
Gupta KR, Sonali S, Askarkar P, Rathod PR, Wadodkar SG. Validated spectrophotometric determination of fenofibrate in formulation. Pharm Sin. 2010;1(1):173-8.
Mathrusri Annapurna M, Tejasri P, Narendra A. New spectrophotometric method for the estimation of fenofibrate. Res J Pharm Technol. 2024;17(6):2753-6. doi: 10.52711/0974-360X.2024.00431.
Gaikwad PV, Sawant SD, Ghante MR, Munot NM. Three simple spectrometric methods for fenofibrate in tablet form. J Pharm Res. 2011;4(6):1741-2.
Jadhav V, Raut C, Dhabale PN. UV-spectrophotometry estimation of fenofibrate in tablet dosage form. Asian J Res Chem. 2010;3(2):326-8.doi: 10.5958/0974-4150.
Noor A, Babu PS, Aravind P. Formulation development and in vitro evaluation of immediate release fenofibrate pellets. Asian J Complement Altern Med. 2014;2(3):1-6.
Nikalje AG, Choudhari VP. Validated TLC method for simultaneous quantitation of atorvastatin ezetimibe and fenofibrate in bulk drug and formulations. Acta Chromatographica. 2011;23(2):267-80. doi: 10.1556/achrom.23.2011.2.6.
Diogo HP, Viciosa MT, Ramos JJ. Differential scanning calorimetry and thermally stimulated depolarization currents study on the molecular dynamics in amorphous fenofibrate. Thermochim Acta. 2016;623:29-35. doi: 10.1016/j.tca.2015.11.012.
Shihabi ZK. Fenofibrate and fenofibric acid analysis by capillary electrophoresis. Electrophoresis. 2004;25(10-11):1648-51. doi: 10.1002/elps.200305849, PMID 15188253.
Salamaa FM, Nassar MW, El Din MM, Attia KA, Kaddah MY. Determination of fenofibrate and the degradation product using simultaneous UV-derivative spectrometric method and HPLC. Am J Anal Chem. 2011;2(3):332-43. doi: 10.4236/ajac.2011.23041.
Lacroix PM, Dawson BA, Sears RW, Black DB, Cyr TD, Ethier JC. Fenofibrate raw materials: HPLC methods for assay and purity and an NMR method for purity. J Pharm Biomed Anal. 1998;18(3):383-402. doi: 10.1016/S0731-7085(98)00051-x, PMID 10096833.
Dutt B, Choudhary M, Budhwar V. Preparation characterization and evaluation of fenofibrate: benzoic acid cocrystals with enhanced pharmaceutical properties. Futur J Pharm Sci. 2021;7(1):170-6. doi: 10.1186/s43094-021-00320-5.
International Conference on Harmonisation (ICH). ICH Q2(R1): Validation of analytical procedures-text and methodology. Geneva: ICH; 2005. p. 10–62.
Jyothi BJ, Kavya RV. Ultraviolet spectrophotometric method development for estimation of new antiviral repurposing drug favipiravir. Asian J Pharm Clin Res. 2021;14(7):67-9. doi: 10.22159/ajpcr.2021.v14i7.41966.
Chauhan I, Singh LU. Development and validation of a simple and cost-effective UV spectrophotometric method for quantifying linezolid. Int J App Pharm. 2024;16(3):211-6. doi: 10.22159/ijap.2024v16i3.50556.
Funde A, Kokat J. A validated stability indicating UV-spectrophotometric simultaneous estimation of rosuvastatin calcium and fenofibrate in bulk and pharmaceutical formulation. Int J Chem Res. 2021;5(1):1-8. doi: 10.22159/ijcr.2021v5i1.144.
Kutty SV, Eapen SC, Shameer M, P FP. Validated UV-visible spectrophotometric method for the estimation of fenofibrate in pure and pharmaceutical formulation using MBTH reagent. Int J Pharm Sci Drug Res. 2012;4(1):74-6. doi: 10.25004/IJPSDR.2012.040113.
Raosaheb GG, Garje MA, Dode AB, Dhaygude AM, Wagh DV, Fartade SJ. Validated spectrophotometric method for simultaneous estimation of fenofibrate and atorvastatin in synthetic mixture and in bulk tablet dosage form. World J Pharm Med Res. 2020;6(7):170-6.