
Int J Pharm Pharm Sci, Vol 18, Issue 4, 14-23Original Article
NOVEL SIMULTANEOUSSTABILITY-INDICATING ESTIMATION METHOD FOR DORZOLAMIDE HYDROCHLORIDE AND TIMOLOL MALEATE BYRP-HPLC: APPLICATIONTOAPIANDPHARMACEUTICAL DOSAGE FORMS
DIVYA PINGILI1, SHWETA BHUTADA3, GUMTE VAISHNAVI2, ARCHANA AWASTHI1*, SARITA CHAURASIA1
1Department of Pharmaceutical Chemistry, Sri Venkateshwara College of Pharmacy, Madhapur, Hyderabad, Telangana-500081, India. 2Department of Pharmaceutical Analysis, Sri Venkateshwara College of Pharmacy, Madhapur, Hyderabad, Telangana-500081, India. 3Department of Pharmacognosy, Sri Venkateshwara College of Pharmacy, Madhapur, Hyderabad, Telangana-500081, India
*Corresponding author: Archana Awasthi; *Email: archi.rinki@gmail.com
Received: 29 Nov 2025, Revised and Accepted: 07 Feb 2026
ABSTRACT
Objective: To develop a novel stability-indicating validated method for the simultaneous determination of dorzolamide hydrochloride (DH) and timolol maleate (TM) in API and pharmaceuticals.
Methods: Reverse-phase chromatographic separation was achieved using a Spursil C18 column with a mixture of methanol and potassium dihydrogen phosphate buffer (7:3v/v) as the mobile phase at pH 3.5. The flow rate was maintained at1.0 ml/min. DH and TM were detected at 290 nm. The method was validated for linearity, accuracy, precision, limit of detection (LOD), limit of quantification (LOQ), and forced degradation studies.
Results: The developed method achieved effective separation, with DH and TM eluting at retention times of 2.189 and 3.136 min for standards, and 2.299 min and 3.091 min for samples, respectively. The method showed excellent linearity across 20–100 µg/ml for DH (r² = 0.999) and 5–25 µg/ml for TM (r2 = 0.9993). The mean recovery percentages were 99.99% for DH and 98.79% for TM, with a percentage relative standard deviation (%RSD) below 2.0, confirming the accuracy and precision of the method. Low LOD and LOQ values indicated high sensitivity, while forced degradation studies confirmed the method's stability, indicating capability.
Conclusion: The validated procedure is reliable, accurate, sensitive, and precise for the simultaneous qualitative analysis and stability assessment of DH and TM in both bulk drugs and commercial pharmaceutical formulations. This method is suitable for routine standard quality control applications.
Keywords: Dorzolamide hydrochloride, Timolol maleate, RP-HPLC, Stability-indicating method, ICH Q2(R1)
© 2026 The Authors. Published by Innovare Academic Sciences Pvt Ltd. This is an open access article under the CC BY license (https://creativecommons.org/licenses/by/4.0/)
DOI: https://dx.doi.org/10.22159/ijpps.2026v18i4.57658 Journal homepage: https://innovareacademics.in/journals/index.php/ijpps
INTRODUCTION
Dorzolamide hydrochloride (DH) is a carbonic anhydrase inhibitor [1]. Timolol maleate (TM) inhibits beta-adrenergic receptors [2]. DH and TM are co-formulated in ophthalmic preparations to treat glaucoma [3] and ocular hypertension [4]. This combination offers superior intraocular pressure control compared to monotherapy [5], thereby reducing the risk of optic nerve damage and loss of vision [6]. Given the chronic use of this therapy and the widespread demand for fixed-dose combinations [7], precise and dependable analytical methods are essential for the concurrent determination of DH and TM in bulk APIs and pharmaceutical formulations.
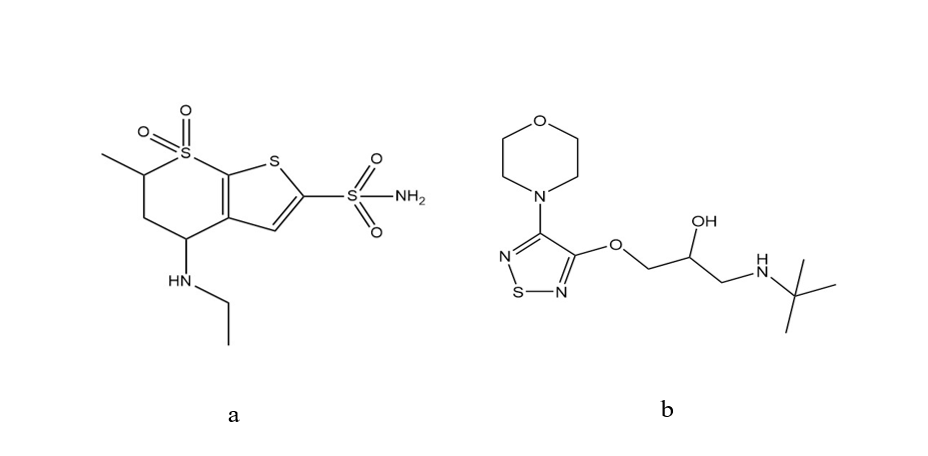
Fig. 1: Structure of (a) Dorzolamide HCl (DH) and (b) Timolol maleate (TM)
Although several spectrophotometric [8-12] and RP-HPLC methods [13] have been reported (table 1), many lack stability-indicating capability, involve lengthy runtimes, or are restricted to single-analyte assays. Recent advances have focused on two directions: stability-indicating [14] chromatographic methods, including UPLC [15] approaches capable of resolving degradation products, and environmentally sustainable (“green”) RP-HPLC methods employing alternative solvents such as isopropanol [16]. Although these strategies highlight progress in analysis and sustainability, the methods remain limited in scope, often lacking comprehensive forced degradation studies or broader applicability to bulk and marketed formulations.
In this context, the current analysis was performed to validate a modified RP-HPLC method for the simultaneous determination of DH and TM. The experiment was planned to deliver quick, reliable, and consistent results while remaining robust and stability indicating, all in line with ICH Q2 (R1) guidelines, providing a dependable analytical approach suitable for routine quality control and regulatory compliance applications [27, 28].
MATERIALS AND METHODS
Chemicals and reagents
The reference standards of DH and TM were kindly supplied by Dr. Reddy’s Laboratories (Hyderabad, India). Methanol (HPLC grade), potassium dihydrogen phosphate (HPLC grade), hydrochloric acid (HPLC grade), sodium hydroxide (HPLC grade), and hydrogen peroxide (HPLC grade) were procured from Qualigens, India. A marketed ophthalmic formulation containing DH and TM was purchased from a local pharmacy for the assay studies.
Instrumentation
Chromatographic analysis was performed using a Shimadzu HPLC system equipped with an autosampler and a diode array detector (DAD), and data acquisition and processing were managed using Spinchrom software. Method optimization was evaluated on multiple reversed-phase columns, including Spursil C18 (150 × 4.6 mm, 3 μm), Phenomenex Zorbax C18-SB (150 × 4.6 mm, 3 μm), and Platisil C18 (150 × 4.6 mm, 3 μm), to achieve optimal resolution and peak performance. Ancillary laboratory equipment included a calibrated electronic balance (SAB2032, Scaletec) for precise weighing, an ultrasonicator (SE60US, Labman Scientific, India) for sample dissolution, a thermal oven (i-THREM A17782, Dwaraka Scientific) for forced degradation studies, and a calibrated pH meter (Orion Star A111, Thermo Scientific) for mobile phase and buffer preparations. Before injection, all solutions were filtered through Millipore 0.45 μm membrane filters.
Table 1: Comparative study for simultaneous determination of DH and TM
| Reference | Bulk API vs dosage form | Method | Column | Mobile phase | Run time | Validation performed | Key findings | Limitations | Research Gap |
| [17] | Dosage Form | RP-HPLC | Inertsil ODS 3V C18(250 x 4.6 mm,5 µm) | Acetonitrile: Octane sulfonic acid buffer (36:64, pH 3.5) | ~8 min | Linearity, accuracy, precision, LOD, LOQ | Sensitive, accurate, simultaneous method with IS (Brimonidine) | Longer run time | Needs adaptation for high-throughput analysis |
| [16] | Dosage Form | Green RP-HPLC | Polymeric C18 (150×4.6 mm, 5 µm) | Isopropanol: Sodium acetate buffer (10:90, pH 4.25) | <8 min | ICH validation, greenness tools | Sustainable method, eco-friendly solvent, good precision | Limited sensitivity at the trace level | Few applications in real biological samples |
| [18] | Dosage Form | RP-HPLC | Zorbax SB C18 (250×4.6 mm, 5 µm) | Phosphate buffer pH 2.5: Acetonitrile (90:10) | 8–10 min | Specificity, linearity, accuracy, precision | Fast, simple, validated for routine QC | Only for dorzolamide, not combo | Needs a simultaneous dual-drug assay |
| [19] | Dosage Form | RP-HPLC | Hypersil BDSC18 (150×4.6 mm, 5 µm) | Methanol: Octane sulfonic acid buffer (55:45) | ~7 min | Accuracy, linearity, recovery | Economical, reproducible method | Less sensitive than PDA/UPLC | Not stability-indicating |
| [20] | Dosage Form | RP-UPLC (Stability-indicating) | Waters BEHC18 (100×2.1 mm, 1.7µm) | Phosphate buffer (pH 2.6): methanol: Acetonitrile (gradient) | 30 min | Specificity, LOD, LOQ, forced degradation | Clear separationof impurities, stability-indicating | Longer gradient run time | Needs faster UPLC gradient programs |
| [21] | Bulk+Dosage Form | RP-HPLC | Phenomenex C18 | Acetonitrile: Buffer (20:80) | ~10 min | Accuracy, precision, linearity | Validated in formulations and fluids | Requires 10–1000 µg/ml range | Bio-analytical validation limited |
| [22] | Dosage Form | RP-HPLC (Bio-analytical) | C18 column | Phosphate buffer pH 6.8: Methanol: Acetonitrile (45:45:10) | ~12 min | Full factorial optimization+PK study | Improved ocular bioavailability | Needs clinical validation | Limited to experimental rabbit models |
| [23] | Dosage Form | RP-HPLC (DAD, UV) | YMC Pack ODS A-132 C18 | Acetonitrile: Phosphate buffer: MeOH (5:85:10) | 10–12 min | Linearity, accuracy, precision | Rapid, sensitive with DAD | Slightly longer run | Less applied to forced degradation |
Preparation of solutions
Preparation of stock solutions
Accurately weighed 20 mg of DH and 5 mg of TM were transferred into a 20 ml volumetric flask. The drugs were dissolved by sonication for 10 min using the mobile phase as diluent, and the volume was adjusted to the mark with the same diluent. This yielded standard stock solutions with final concentrations of 1000 µg/ml for DH and 250 µg/ml for TM.
Preparation of working standard solutions
Working Standard solutions were obtained by serial dilution of the stock solutions to achieve concentration ranges of 20-100 µg/ml for DH and 5-25 µg/ml for TM. These dilutions were used for method validation and analysis of the calibration parameters.
Preparation of buffer and mobile phase
The buffer solution was prepared by dissolving 1.6 g of potassium dihydrogenphosphate (KH₂PO₄) in 250 ml of HPLC-grade water, and the pH was adjusted to 3.5±0.05 using dilute acetic acid solution. The mobile phase was prepared by mixing 300 ml of this buffer (30%) with 700 ml of methanol (70%), followed by degassing in an ultrasonic bath for 15 min and filtration through a 0.45 µm Millipore vacuum filter. The same mobile phase was used as a diluent for all solution preparations.
Chromatographic conditions
Several trials were conducted to optimize the chromatographic parameters for the simultaneous estimation of DH and TM (table 2). The method employed a Spursil C18-EP column (150×4.6 mm, 3 μm) with a mobile phase consisting of KH₂PO₄ buffer (pH 3.5) and methanol in a 7:3 ratio. The pH of the mobile phase was adjusted to 3.5 using dilute acetic acid and delivered at a flow rate of 1.0 ml/min. Detection was performed at 290 nm at ambient column temperature, with an injection volume of 20µl. Under these conditions, both analytes were eluted as sharp, symmetrical peaks within 10 min, demonstrating excellent resolution and system suitability.
Method validation
The proposed RP-HPLC method was validated according to the ICH Q2(R1) guidelines to ensure its suitability for the simultaneous estimation of DH and TM. The validation parameters included specificity, linearity, accuracy, precision, sensitivity (LOD and LOQ), robustness, and assay performance.
Specificity
Specificity was assessed by comparing the chromatograms of standard solutions with those of sample solutions to confirm that the DH and TM peaks were well-resolved and free from excipients or other formulation components.
Linearity
Linearity was established over 20–100µg/ml for DH, 5-25µg/ml for TM. Five standard levels (20, 40, 60, 80, 100 µg/ml for DH; 5, 10, 15, 20, 25 µg/ml for TM) were prepared by serial dilution, and calibration curves were plotted in triplicate with concentration on the X-axis and the peak area on the Y-axis.
Accuracy
Accuracy was determined using the standard addition method at 50%, 100%, and 150 % of the nominal concentration by spiking placebo matrices with known amounts of the analytes. Each solution was analysed in triplicate (n=3), and percentage recoveries were calculated.
Precision
Repeatability (intra-day precision) was evaluated by injecting six replicates (n=6) of a solution containing 60 µg/ml DH and 15 µg/ml TM on the same day. Intermediate precision (inter-day) was assessed by testing the same solution over three consecutive days of analysis.
Sensitivity
The LOD and LOQ were determined using serial dilutions based on signal-to-noise ratios of 3:1 and 10:1, respectively.
Robustness
Robustness was evaluated by introducing small deliberate variations in chromatographic conditions, including flow rate (±0.2 ml/min) and mobile phase composition (±10%), to assess method reliability under varied conditions.
Assay of the dosage form
The Validated method was applied to a marketed formulation containing DH and TM to confirm the method’s suitability for routine quality control analysis.
Forced degradation studies
Forced degradation studies were performed to assess the stability-indicating capability of the developed RP-HPLC method, in accordance with the ICH Q1A(R2) guidelines [26-28]. Both DH and TM, as bulk drugs and in a combined formulation, were subjected to the following stress conditions [24, 25].
Acidic degradation: Treatment with 0.1N HCl at 60 °C for 1 h, followed by neutralization with NaOH.
Alkaline degradation: Treatment with 0.1 N NaOH at 60 °C for 1 h, followed by neutralization with HCl.
Oxidative degradation: Treatment with 10% H₂O₂ at 70 °C for 30 min.
Thermal degradation: Solid drug samples were exposed to 80 °C for 24 h in a hot-air oven.
Photolytic degradation: Solid and formulated samples were exposed to UV light (254 nm) for 24 h.
Stressed samples were diluted to working concentrations and ed under optimized chromatographic conditions. Chromatograms were examined for retention time shifts, peak purity, and the appearance of degradation products to confirm the stability-indicating performance of the method [29].
RESULTS AND DISCUSSION
Chromatographic optimization
A series of preliminary trials (table 2) was conducted using different C18 columns and mobile phase systems to achieve sharp and symmetrical peaks and reliable separation between DH and TM. Early experiments with Spursil C18 and Platisil C18 columns using either methanol-or acetonitrile-based phases produced suboptimal outcomes, including poor resolution, broad peak shapes, and long retention times (RTs). The use of a Phenomenex ZorbaxC18-SB column with a triethylamine buffer improved reproducibility; however, it did not fully satisfy the system suitability requirements.
Table 2: Chromatographic trials for simultaneous detection of DH and TM
| Trial | Column (150 × 4.6 mm, 3 μm) | Mobile phase | pH | Flow rate (ml/min) | λmax (nm) | Run time (min) |
| 1 | Spursil C18 | Water: Methanol (50:50) | – | 1 | 290 | 8 |
| 2 | Spursil C18 | Water: Acetonitrile (70:30) | – | 1 | 290 | 10 |
| 3 | Platisil C18 | Methanol: Acetonitrile (50:50) | – | 1 | 290 | 10 |
| 4 | Platisil C18 | Methanol: Acetonitrile (60:40) | – | 1 | 290 | 10 |
| 5 | Phenomenex ZorbaxC18-SB | Methanol: Triethylamine (60:40) | 5 | 1 | 290 | 10 |
| Optimized* | Spursil C18-EP | Methanol: KH₂PO₄ (70:30) | 3.5 | 1 | 290 | 10 |
*Final optimized method
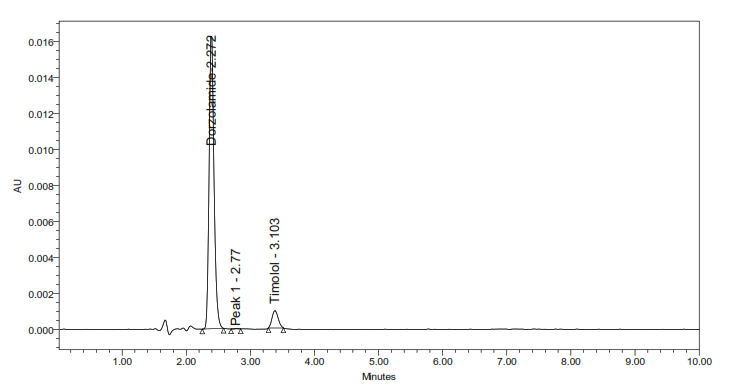
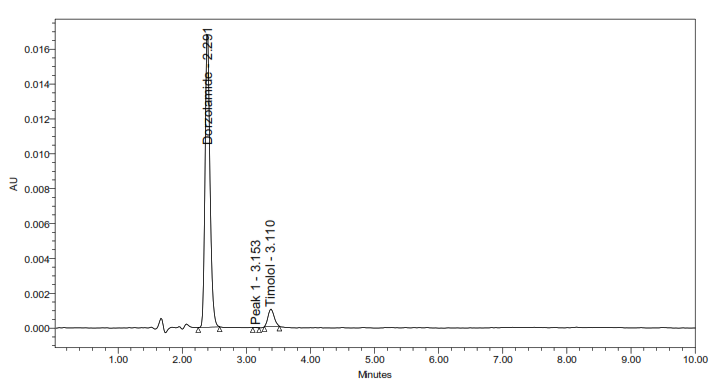
The optimal chromatographic performance was obtained with a SpursilC18-EP column (150×4.6 mm, 3 µm), employing a mobile phase of Methanol: KH₂PO₄ buffer in a 70:30 (v/v) ratio (pH of mobile phase adjusted to 3.5 using dilute acetic acid solution), at 1.0 ml/min flow rate and 10 min runtime. UV detection was performed at 290 nm. Under these optimized conditions, analyte elution was completed within 4 min. The extended runtime ensured the complete elution of late-eluting compounds. With the optimized method, DH and TM were eluted at 2.189 minand3.136 min, respectively, with no other peaks until the total 10 min runtime. The USP tailing factors (1.25 for DH and 1.22 for TM) and theoretical plate counts (3302 and 3232, respectively) confirmed the efficacy and robustness of this method.
System suitability testing further demonstrated peak efficiency (plate count>3000), symmetry (tailing<1.3), and satisfactory resolution (>2.0) between the two analyte peaks.
Method validation
Validation was performed according to the guidelines of the International Council for Harmonisation Quality, [ICH Q2(R1) guidelines].
Specificity
The selectivity of the method was established by comparing the chromatograms of the blank, standard, and sample solutions (fig. 2). The analyte peaks were clearly resolved and showed no interference from the excipients or other formulation components. The retention times were highly consistent between the standard and sample runs, with comparable peak areas, heights, and acceptable tailing factors (≤ 2.0). The resolution values were greater than 2.0, and the plate counts exceeded 3000 (table 3 good separation, symmetry, and column performance.
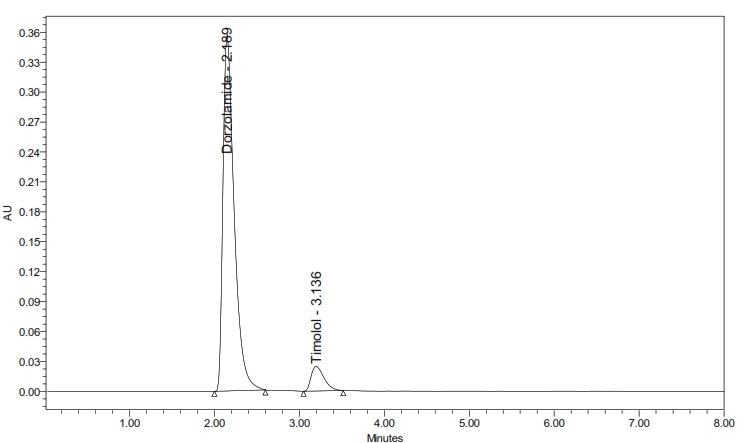
Fig. 2: Chromatogram showing separation of DH (Rt ~ 2.189) and TM (RT ~3.136) under optimized RP-HPLC conditions, where the runtime employed was 10 min; both analytes eluted within 4 min *The runtime of the optimized method was 10 min, and elution of both analytes was completed within 4 min
Table 3: Comparative study for simultaneous determination of DH and TM
| S. No. | Standard/Sample | RT (min) | Area (µV sec) | Height (µV) | Tailing | Resolution | Plate count |
| 1. | DH STD | 2.189 | 2440824 | 248902 | 1.02 | 6.2 | 3409 |
| 2. | TM STD | 3.136 | 224215 | 28842 | 1.12 | 3342 | |
| 1. | DHSAMPLE | 2.299 | 2440781 | 248834 | 1.25 | 6.3 | 3302 |
| 2. | TM SAMPLE | 3.091 | 224115 | 28834 | 1.22 | 3232 |
System suitability parameters for standard and sample solutions. Data represents mean of triplicate (n=3) injections.
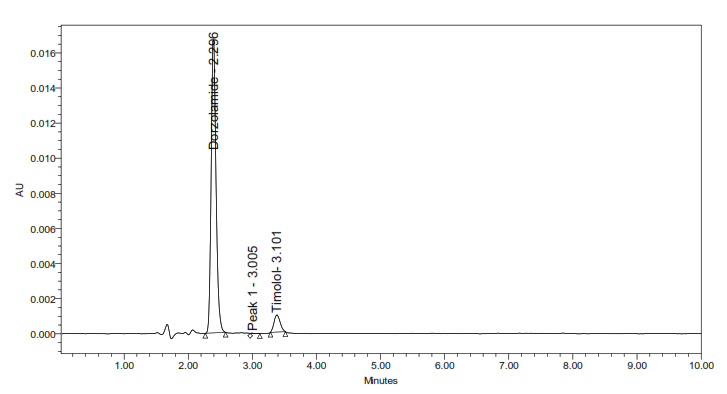
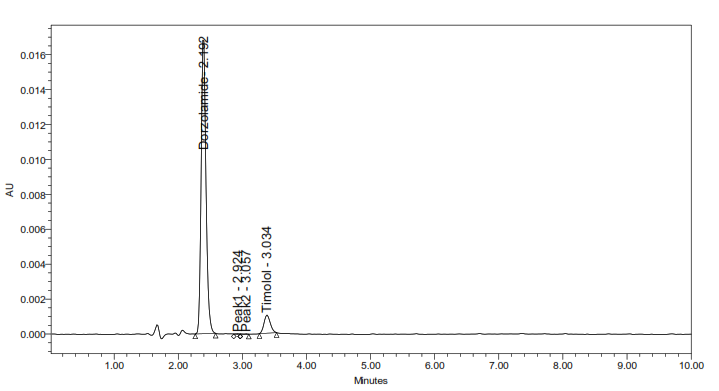
A: Blank chromatogram: chromatogram of blank solution under optimized conditions
B: Standard chromatogram: chromatogram showing separation of DH (RT ~2.19 min) and TM (RT ~3.14 min) in the standard under optimized conditions in the standard
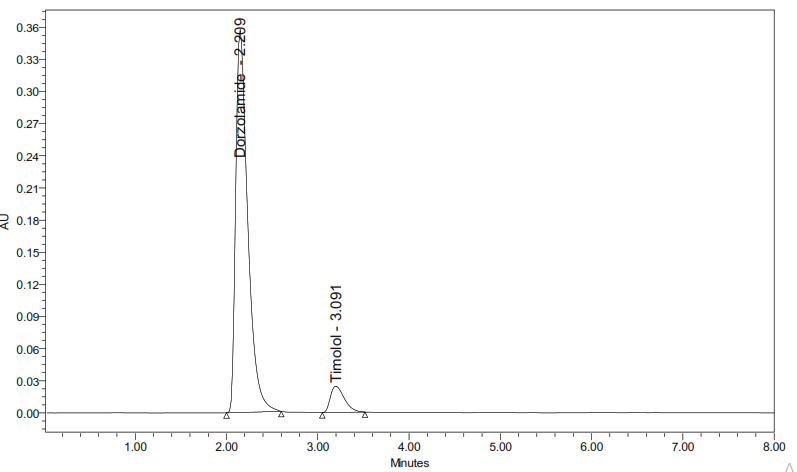
C: Sample chromatogram: chromatogram showing separation of DH (RT ~2.3 min) and TM (RT ~3.09 min) in the sample under optimized conditions
Fig. 3: Chromatograms of the blank (A), standard (B), and sample (C) solutions using the optimized RP-HPLC method, runtime 10 min
Linearity
The calibration plots exhibited excellent linearity across the tested ranges of 20–100 µg/ml for DH and 5–25 µg/ml for TM (table 4), with the coefficient of correlation (r²) consistently>0.999.
Accuracy
Recovery studies carried out by standard addition yielded values between 98.1% and 99.5% (table 5), hich were within the acceptable range of 98–102%. The relative standard deviation (RSD) values were below 2%, confirming the accuracy of the proposed method.
Precision
Intra-and inter-day precision studies (table 6) demonstrated %RSD values below 2% for both the analytes. The low variability confirmed the good repeatability and intermediate precision of the method.
Sensitivity
The method exhibited sufficient sensitivity for routine use, with limits of detection (LOD) and quantification (LOQ) of 0.05/0.18 µg/ml for DH and 0.11/0.39 µg/ml for TM (table 7).
Robustness
Minor deliberate variations in the analytical conditions, such as flow rate and mobile phase ratio (table 8), had no significant impact on retention time, resolution, or peak shape. All system suitability values remained within the acceptance criteria, thereby supporting the robustness of the procedure.
Assay of dosage form
The method was applied to a marketed formulation containing DH and TM, and the assay values were within 98–102% of the label claim. RSD values were<2% (table 9), confirming the method is suitable for routine quality control.
Forced degradation studies
Stress testing under acidic, alkaline, oxidative, photolytic, and thermal conditions (table 10) demonstrated the stability-indicating capacity of the proposed method. DH degraded under acidic and oxidative conditions, consistent with its sulfonamide structure, whereas TM degraded under thermal and photolytic stress, reflecting the known photosensitivity of β-blockers. Both drugs showed minimal degradation in alkaline conditions (<1%), highlighting their relative stability. The degradation peaks were clearly separated from the parent drug peaks (fig. 5), and purity analysis confirmed the homogeneity of each peak. In all stress conditions, the Rf exceeded 2.0, demonstrating that the developed RP-HPLC method is capable of reliably distinguishing the DH and TM from the degradation products.
Table 4: Linearity for the simultaneous estimation of DH and TM
| DH | TM | |
| Linearity level | Concentration (µg/ml) | Mean peak area (DH) |
| 1 | 20 | 813593 |
| 2 | 40 | 1627187 |
| 3 | 60 | 2440781 |
| 4 | 80 | 3254374 |
| 5 | 100 | 4067968 |
| Regression equation parameters | ||
| Slope (m) | 40823 | 14929 |
| Intercept (c) | 23810 | 1892.4 |
| Coefficient of correlation (r2) | 0.9993 | 0.9993 |
Calibration curves constructed in triplicate (n=3). r² calculated from linear regression analysis
Table 5: Accuracy results for the simultaneous estimation of DH and TM
| Level | Drug added DH/TM (mg) | Drug found DH/TM (mg) | % Recovery (DH) | % Recovery (TM) |
| 50% | 10.00/2.50 | 9.90/2.45 | 99 | 98 |
| 100% | 20.00/5.00 | 19.85/4.95 | 99.3 | 99 |
| 150% | 30.00/7.50 | 28.95/7.30 | 96.5 | 97.3 |
| Average % Recovery | 98.27% | 98.10% |
Accuracy determined by the standard addition method at three levels (50%, 100%, 150%). Each level was analyzed in triplicate (n=3).
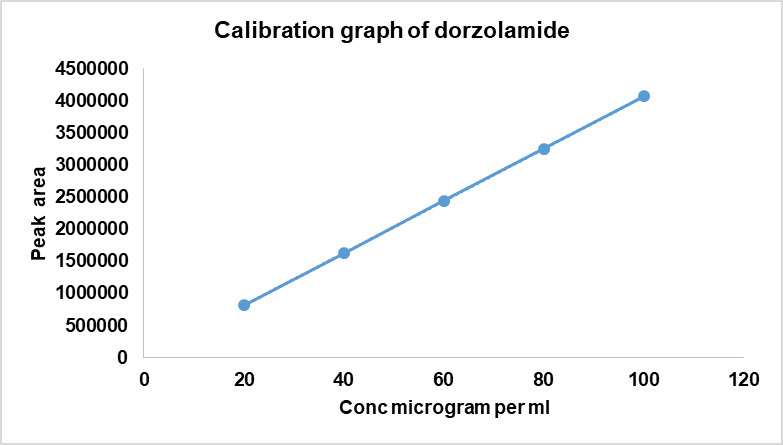
Fig. 4a: DH calibration graph
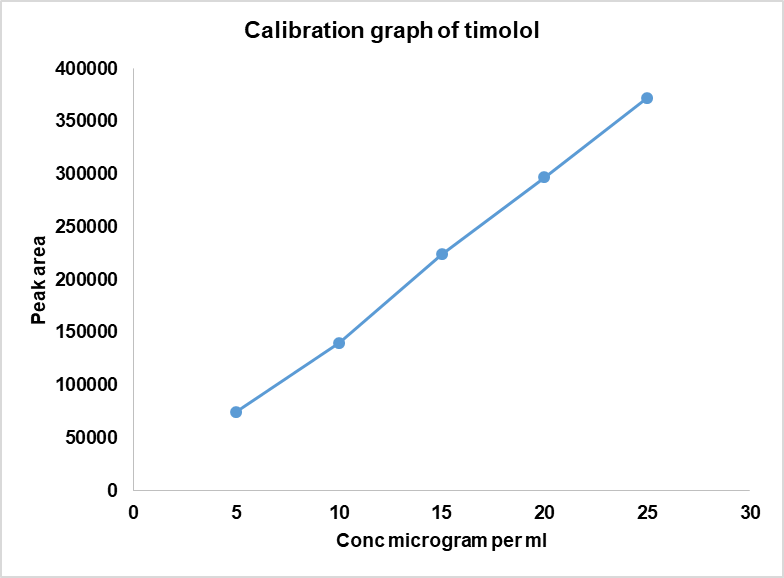
Fig. 4b: TM calibration graph
Table 6: Precision results for the simultaneous estimation of DH and TM
| Parameter | DH%RSD | TM%RSD |
| Intra-day | 1.5 | 0.6 |
| Inter-day | 0.16 | 0.18 |
Intra-day precision: six replicates analyzed on the same day. Inter-day precision: same concentration analyzed over three consecutive days (n=6).
Table 7: Sensitivity results for the simultaneous estimation of DH and TM
| Parameter | DH(µg/ml) | TM(µg/ml) |
| LOD | 0.05 | 0.11 |
| LOQ | 0.18 | 0.39 |
LOD and LOQ were calculated based on signal-to-noise ratios of 3:1 and 10:1, respectively.
Table 8: Robustness results for the simultaneous estimation of DH and TM
| DH | TM | Rs* | ||||||||
| Parameter varied | Condition varied | P | T | Rt (min) | Wb (min) | P | T | Rt (min) | Wb (min) | |
| Flow rate | 0.8 ml/min (Less) | 3299 | 1.21 | 2.519 | 0.8 | 3231 | 1.1 | 3.754 | 0.20 | 6.5 |
| 1.0 ml/min (optimized) | 3302 | 1.25 | 2.189 | 0.16 | 3232 | 1.22 | 3.136 | 0.18 | 5.6 | |
| 1.2 ml/min (More) | 3312 | 1.23 | 1.916 | 0.15 | 3235 | 1.26 | 2.926 | 0.17 | 6.4 | |
| Organic content in mobile phase | 10% less | 3299 | 1.21 | 2.438 | 0.18 | 3231 | 1.1 | 3.812 | 0.20 | 7.2 |
| Actual (optimized) | 3302 | 1.25 | 2.189 | 0.16 | 3232 | 1.22 | 3.136 | 0.18 | 5.6 | |
| 10% more | 3312 | 1.23 | 1.985 | 0.14 | 3235 | 1.26 | 2.856 | 0.16 | 5.7 | |
Note: Rt = Retention time; N = Theoretical plates; T = Tailing factor; Wb = Peak base width; Rs = Resolution between DH and TM peaks, # Variations were introduced individually while keeping other parameters at optimized conditions.
Table 9: Assay results for the simultaneous estimation of DH and TM
| Drug | Label claim (mg/ml) | Amount found (mg/ml) (mean ±SD) | % Assay | % RSD |
| DH in formulation | 20 | 19.998±0.30 | 99.99 | 1.5 |
| TM in formulation | 5 | 4.940±0.03 | 98.79 | 0.6 |
*Assay results for marketed formulation (label claim: 20 mg DH+5 mg TM per ml). Each value represents mean±standard deviation, (n=3).
5a: Acidic degradation
5b. Alkaline degradation
5c. Thermal degradation
5d: Oxidative degradation
5e. Photolytic degradation
Fig. 5: Representative chromatograms from forced degradation studies showing separation of DH and TM from their degradation products (where applicable)
Table 10: Forced degradation studies for the simultaneous estimation of DH and TM
| Stress condition | DH | TM | ||||
| Peak area | % Area remaining | % Degraded | Peak area | % Area remaining | % Degraded | |
| Standard (Control) | 2,440,824 | 100 | — | 224,215 | 100 | — |
| Acidic | 2,330,627 | 95.48345 | 4.5 | 214,236 | 95.5391 | 4.4 |
| Alkaline | 2,421,303 | 99.18224 | 0.8 | 223,210 | 99.55222 | 0.4 |
| Oxidative | 2,342,870 | 95.9399 | 4 | 215,244 | 95.95317 | 4 |
| Thermal | 2,421,779 | 99.1806 | 0.8 | 214,213 | 95.54 | 4.4 |
| Photolytic | 2,411828 | 98.77091% | 1.2 | 213,165 | 95.09399% | 4.9 |
DISCUSSION
The developed method for the simultaneous RP-HPLC determination of DH and TM fulfilled the ICH Q2(R1) criteria across all validation parameters. Compared with earlier reports (table 1), it offers distinct advantages, including a shorter elution time (<4 min) with 10 min total runtime, sharp peak resolution, and validated stability-indicating capability [17-23]. The optimized method completed analysis nearly four times faster than the method reported by Ramakrishna [31] while maintaining comparable specificity. Unlike most previous studies that either lacked degradation profiling or required lengthy gradient runs, this method provides efficient simultaneous quantification of DH and TM in bulk and dosage forms. Forced degradation studies (fig. 5) confirmed the stability-indicating capability of the method. The method achievedbaseline separation (Rs>2.0) of intact drugs from their degradation products. Under acidic, alkaline, oxidative, thermal, and photolytic stress conditions, the method showed degradation ranging from 0.4-4.9%.
Robustness testing maintained acceptable system suitability parameters [18]. Deliberate variations in mobile phase composition and flow rate (table 8) resulted in consistently high-resolution values (Rs= 5-6-7.0) exceeding the minimum requirement. All system suitability parameters remained within acceptable limits, confirming the method's robustness for routine analysis.
Overall, this method integrates rapid analysis with strong validation and robust degradation profiling, rendering it suitable for routine quality control and stability assessment. The method's applicability to both bulk APIs and finished dosage forms represents an advantage over methods limited to single matrices [18, 22]. Although the use of methanol and phosphate buffer limits its alignment with green chemistry [16] and the degradation products were not structurally characterized, the method still represents a significant improvement over existing approaches. Future work could extend its applicability using greener solvents and LC–MS characterization of degradants.
CONCLUSION
A validated stability-indicating RP-HPLC method was successfully developed for the simultaneous estimation of DH and TM in bulk and pharmaceutical dosage forms. The method is simple, rapid, accurate, precise, and robust, fully meeting the ICH Q2(R1) requirements for analytical methods. Forced degradation studies further confirmed its ability to separate drugs from their degradation products under diverse stress conditions, underscoring its suitability for routine equality control, stability testing, and regulatory applications in the pharmaceutical industry.
ACKONWLEDMENT
The authors would like to express their gratitude to Dr. Reddy’s Laboratories (Hyderabad, India). for providing the drug samples and technical support provided by the Analytical Instrumentation Facility of Sri Venkateshwara College of Pharmacy, Hyderabad.
FUNDING
Nil
ABBREVIATIONS
DH: Dorzolamide hydrochloride, TM: Timolol maleate, RP-HPLC: reverse-phase high-performance liquid chromatography. RSD: relative standard deviation; RT: retention time; Rs: resolution; UPLC: ultra-performance liquid chromatography; ICH: International Council for Harmonization; LOD: limit of detection; LOQ: limit of quantification.
AUTHORS CONTRIBUTIONS
CONFLICT OF INTERESTS
The authors report that there is no conflict of interest
REFERENCES
Sugrue MF. The preclinical pharmacology of dorzolamide hydrochloride a topical carbonic anhydrase inhibitor. J Ocul Pharmacol Ther. 1996;12(3):363-76. doi: 10.1089/jop.1996.12.363, PMID 8875343.
Curran MP, Orman JS. Bimatoprost/timolol: a review of its use in glaucoma and ocular hypertension. Drugs Aging. 2009 Feb;26(2):169-84. doi: 10.2165/0002512-200926020-00008, PMID 19220073.
Sacca SC, La Maestra S, Micale RT, Larghero P, Travaini G, Baluce B. Ability of dorzolamide hydrochloride and timolol maleate to target mitochondria in glaucoma therapy. Arch Ophthalmol. 2011;129(1):48-55. doi: 10.1001/archophthalmol.2010.324, PMID 21220628.
Bell NP, Ramos JL, Feldman RM. Safety, tolerability and efficacy of fixed combination therapy with dorzolamide HCl 2% and timolol maleate 0.5% in glaucoma and ocular hypertension. Clin Ophthalmol. 2010;4:1331-46. doi: 10.2147/OPTH.S14054, PMID 21139674.
Fechtner RD, Khouri AS, Realini T. Fixed-combination drugs. In: Netland PA, ed. Glaucoma Medical Therapy: Principles and Management. 2nd ed. Oxford: Oxford University Press in Cooperation with the American Academy of Ophthalmology; 2008. p. 139–50.
Ormrod D, McClellan K. Topical dorzolamide 2%/timolol 0.5%: a review of its use in the treatment of open-angle glaucoma. Drugs Aging. 2000;17(6):477-96. doi: 10.2165/00002512-200017060-00005, PMID 11200308.
Yeh J, Kravitz D, Francis B. Rational use of the fixed combination of dorzolamide timolol in the management of raised intraocular pressure and glaucoma. Clin Ophthalmol. 2008;2(2):389-99. doi: 10.2147/opth.s1813, PMID 19668730.
Mandour AA, Nabil N, Zaazaa HE, Abdelkawy M. Review on analytical studies of some pharmaceutical compounds containing heterocyclic rings: brinzolamide timolol maleate, flumethasone pivalate and clioquinol. Future J Pharm Sci. 2020;6(1):52. doi: 10.1186/s43094-020-00068-4.
Patel K, Kotadiya R. Advancements in the analytical methods for ripasudil hydrochloride hydrate and timolol maleate: a recently approved FDC. Curr Pharm Anal. 2023;19(6):487-96. doi: 10.2174/1573412919666230807114942.
Lotfy HM, Saleh SS. Recent development in ultraviolet spectrophotometry through the last decade (2006-2016): a review. Int J Pharm Pharm Sci. 2016;8(10):40-56. doi: 10.22159/ijpps.2016v8i10.13537.
Karpinska J. Derivative spectrophotometry-recent applications and directions of developments. Talanta. 2004;64(4):801-22. doi: 10.1016/j.talanta.2004.03.060, PMID 18969675.
Reid IO, Osman SM, Bakheet SM. Comprehensive review of analytical techniques for evaluating fixed-dose combinations containing timolol. Results Chem. 2025;7:102309. doi: 10.1016/j.rechem.2025.102309.
Gilpin RK, Gilpin CS. Pharmaceuticals and related drugs. Anal Chem. 2011;83(12):4489-507. doi: 10.1021/ac2008674, PMID 21480659.
Mandour AA, Nabil N, Zaazaa HE, Ibrahim MM, Ibrahim MA. Two stability-indicating chromatographic methods: TLC densitometric versus HPLC method for the simultaneous determination of brinzolamide and timolol maleate in ophthalmic formulation in the presence of probable carcinogenic oxidative degradation product of timolol maleate. Separations. 2023;10(1):37. doi: 10.3390/separations10010037.
Eluru A, Babu KS. A new RP-UPLC method for the separation and simultaneous quantification of dorzolamide HCl and timolol maleate. Int J App Pharm. 2024;16(3):244-50. doi: 10.22159/ijap.2024v16i3.49491.
El Deeb S, Abdelsamad K, Parr MK. Whiter and greener RP-HPLC method for simultaneous determination of dorzolamide, brinzolamide and timolol using isopropanol as a sustainable organic solvent in the mobile phase. Separations. 2024 Mar 12;11(3):83. doi: 10.3390/separations11030083.
Annapurna M, Annapurna A, Narendra A. Development and validation of RP-HPLC method for simultaneous determination of dorzolamide HCl and timolol maleate in pharmaceutical dosage forms. Int J Pharm Biomed Res. 2012;2(2):30-6. doi: 10.22270/jddt.v2i2.120.
Thangabalan B, Kahsay G, Eticha T. New RP‐HPLC method development and validation for dorzolamide hcl in ophthalmic dosage form. J Anal Methods Chem. 2018;2018(1):4596141. doi: 10.1155/2018/4596141.
Wanare RS, Kabra AO, Deshmukh A, Aher N. Simultaneous estimation of dorzolamide HCl and timolol maleate in eye drops by a RP-HPLC method. Pharm Globale. 2012;3(3):1-5.
Sharma N, Rao SS, Reddy AM. A novel and rapid validated stability-indicating UPLC method of related substances for dorzolamide hydrochloride and timolol maleate in ophthalmic dosage form. J Chromatogr Sci. 2012;50(9):745-55. doi: 10.1093/chromsci/bms025, PMID 22562819.
Sher N, Shafi N, Naseem H, Khan MA. A novel RP-HPLC method for simultaneous estimation of dorzolamide HCl and timolol maleatein ophthalmic products. Pak J Chem. 2020;10(1-4):1-6. doi: 10.15228/2020.v10.i01‑4.p01.
Shah PA, Gevariya NR, Christian JR, Govind Patel KG, Thakkar VT, Gohel MC. Science-based development of viscous eye drop of dorzolamide hydrochloride and timolol maleate using full factorial design. Pharm Methods. 2018;9(2):69-78. doi: 10.5530/phm.2018.2.13.
Erk N. Rapid and sensitive HPLC method for the simultaneous determination of dorzolamide HCl and timolol maleatein eye drops with diode-array and UV detection. Pharm-An Int J of Pharm Sci. 2003;58(7):491-3. PMID 12889534.
Manoranjani M. A study of method development validation and forced degradation for simultaneous quantification of cisplatin and fluorouracil in bulk and pharmaceutical dosage form by RP-HPLC. J Pharm Sci Res. 202;13(3):155-61.
Kirubakaran N, Umashankar MS, Bhuvaneshwari S. Analytical methods of estimation of oxetacaine and its quality determinations in different pharmaceutical formulations by reverse phase high performance liquid chromatography (RP-HPLC). Res J Pharm Technol. 2023;16(12):5748-53. doi: 10.52711/0974-360X.2023.00930.
ICH Q2(R1). Validation of analytical procedures: text and methodology. Geneva: International Council for Harmonisation; 2005.
Marina Juliet A, Thanikachalam PV. Development and validation of QBD-assisted using central composite design RP-HPLC method for lobeglitazone sulfate and glimipiride in bulk and its combined dosage form. Chromatographia. 2025;88(5):381-93. doi: 10.1007/s10337-025-04404-9.
Gawde O, Nayak S, Vaidhun B. Analysis of nefopam hydrochloride from bulk and dosage form using validated RP HPLC method. Int J Pharm Sci Innov. 2021;1(2):40-53.
Veneela AS, Rajitha GA, Narikimalli AS. A stability indicating RP-HPLC method development and validation for the simultaneous estimation of daunorubicin and cytarabine in bulk and pharmaceutical dosage form. Asian J Pharm Clin Res. 2022;15(5):58-63. doi: 10.22159/ajpcr.2022.v15i5.43682.
Katolkar PA, Jaiswal SH. Analytical method development and validation for the estimation of cyamemazine tartrate in formulation by RP-HPLC with stability indicating. Asian J Pharm Clin Res. 2022;15(9):28-32. doi: 10.22159/ajpcr.2022.v15i9.45154.
Ramakrishna K, Kumar S. Development and validation of stability-indicating RP-HPLC method for simultaneous determination of dorzolamide hydrochloride and timolol maleate in ophthalmic dosage form. Int J Appl Pharm. 2025;17(6):512-25. doi: 10.22159/ijap.2025v17i6.55359.
C Deepa Latha, MB Leela Pratyusha. To study the drug use pattern in primary open-angle glaucoma in a tertiary care teaching hospital. Asian J Pharm Clin Res. 2017;10(2):198-200. doi: 10.22159/ajpcr.2017.v10i2.15172.